
 By Islam Baraka
The governed definitions this build depends on. Read them first if a term is unfamiliar.
- PrimaryRobust Trendline FittingRobust Trendline Fitting is a deterministic line-fitting method that selects the largest consensus of confirmed same-kind pivots before refitting.
- PrerequisiteCausal Pivot DetectionCausal Pivot Detection is a reproducible OHLC extremum detector that publishes a candidate only after its right neighborhood exists.
- PrerequisiteHigh PivotHigh Pivot is a bar whose high dominates its left neighborhood and is at least as high as its right neighborhood.
- PrerequisiteSupport/Resistance ClusteringSupport/Resistance Clustering is a deterministic density clustering method that turns confirmed same-kind pivots into horizontal level candidates.
- ImportantConsensus InlierConsensus Inlier is a pivot whose log-price residual from a candidate line is within the declared tolerance.
- ImportantDeterministic Trendline Tie-BreakDeterministic Trendline Tie-Break is the fixed ordering used when multiple line hypotheses have comparable consensus.
- ImportantLocked Inlier MembershipLocked Inlier Membership is the policy of freezing the winning hypothesis's inlier set before the OLS refit.
- ImportantLog-Price OLS RefitLog-Price OLS Refit is the ordinary least-squares line refit on the locked consensus inliers in log-price space.
- ImportantLog-Price TrendlineLog-Price Trendline is a straight line fitted to the natural logarithm of positive pivot prices.
- ImportantMaximum-Consensus SelectionMaximum-Consensus Selection is the rule that chooses the candidate line with the largest number of inlier pivots.
- ImportantMedian Residual BPSMedian Residual BPS is the median absolute trendline residual reported in basis points on the ratio scale.
- ImportantMinimum Inlier RuleMinimum Inlier Rule is the minimum consensus size required before a trendline is returned.
- ImportantProjection at Requested IndexProjection at Requested Index is the value obtained by evaluating the fitted line at a requested event index.
- ImportantResidual ToleranceResidual Tolerance is the inclusive ratio-distance threshold used to classify trendline residuals.
- ImportantTrendline Extrapolation ScopeTrendline Extrapolation Scope is the explicit limit that a fitted line is descriptive outside the observed pivot set.
- ImportantTrendline InterceptTrendline Intercept is the fitted log-price value at event index zero.
- ImportantTrendline Slope per BarTrendline Slope per Bar is the log-price slope associated with one event-index bar of the fitted line.
- ImportantTwo-Point Line HypothesisTwo-Point Line Hypothesis is a candidate line defined by two distinct confirmed pivot event indexes.
Which straight line is supported by the largest consensus of confirmed pivots despite isolated gross errors? That is the practical question behind this tutorial. A deterministic consensus fit answers which line is supported by the largest set of confirmed pivots. It keeps a single poisoned point from rotating an all-points least-squares line.
The goal is not to make a persuasive chart. It is to build an object whose definition, clocks, parameters, invalid states, and diagnostics survive code review and point-in-time testing.
The useful output before the implementation
Use the line as a descriptive sloped level, a diagnostic, or a pattern-feature input. Do not choose pivots or tolerance after seeing a desired line, annualize the slope without a calendar contract, or call projection a forecast.
The selected package variant is Exhaustive two-point consensus in log-price space, inclusive residual tolerance, deterministic tie-breaking, then least-squares refit on inliers. A different price field, threshold unit, equality rule, seed, window, or repainting policy defines a different algorithm. Record the convention with every result.
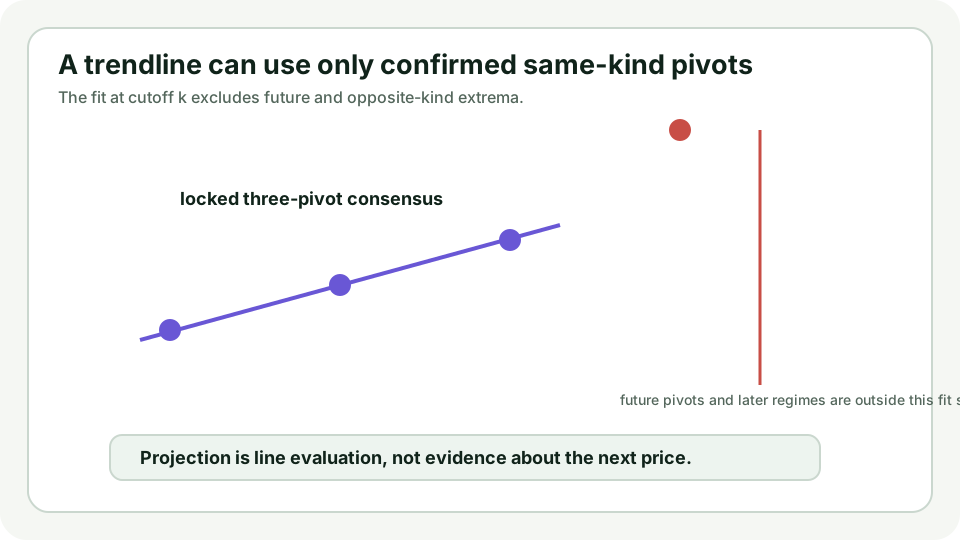
The visual separates where geometry occurred from when the required evidence arrived. That distinction is the family’s central protection against hindsight.
Inputs, ownership, and the rejection boundary
| Field | Type | Meaning | Required policy |
|---|---|---|---|
| kind | high or low | resistance or support fit | select one kind only |
| event_index | integer at least 0 | x coordinate | unique within kind |
| confirmation_index | integer | knowledge time | at least event_index and within caller cutoff |
| price | finite positive number | pivot price | transformed to log price |
| tolerance_bps | finite positive number | inclusive residual ratio distance | converted with log1p |
| min_inliers | integer at least 3 | required consensus | no fit below this count |
| max_points | integer | recent same-kind pivot memory | at least min_inliers |
Synthetic fixtures are clearly labeled and use one instrument basis. Production data must additionally carry source ownership, session, time zone, adjustment basis, and finality. Missing, malformed, mixed-basis, future-dated, or revised inputs are not silently repaired.
Build intuition before notation
Every pair proposes a line. The best hypothesis is the one supported by the most pivots within tolerance; only that consensus is used for the final refit. Consensus membership is selected by the two-point hypothesis score and then locked for one least-squares refit. Reclassifying after refit defines another algorithm. The projected price is merely line evaluation outside the observed pivot set.
The nearby methods below can all be reasonable, but their outputs are not interchangeable.
| Variant | Definition | Best use | Limitation |
|---|---|---|---|
| This package | enumerate every pair; deterministic score; locked consensus; one OLS refit | small pivot sets and reproducible education | quadratic pair enumeration |
| Random RANSAC | random minimal samples with stopping probability | large noisy datasets | requires seed and trial policy |
| All-points OLS | minimize squared residuals over every pivot | clean approximately linear data | one gross outlier can rotate the fit |
| Theil-Sen | median of pairwise slopes | robust central slope | different estimator and intercept convention |
The complete mathematical contract
| Symbol | Meaning | Unit |
|---|---|---|
| t_i | pivot event index | bars |
| z_i | log pivot price | log-price |
| h | two-point line hypothesis | model |
| I(h) | inclusive residual consensus | set of pivot indexes |
| epsilon_bps | exact ratio residual tolerance | basis points |
| a, b | refit intercept and log slope | log-price; log-price per bar |
Plain-language interpretation: every output is the consequence of a declared comparison. Strict and inclusive boundaries, threshold transforms, clock cutoffs, and null results are part of the method, not cleanup details.
Reproduce the canonical trace
These are author-derived calculations over synthetic input:
| Index or object | Value | State | Result |
|---|---|---|---|
| 0 | 4.60 | on z = 4.60 + 0.01t | inlier |
| 10 | 4.70 | on z = 4.60 + 0.01t | inlier |
| 20 | 4.80 | on z = 4.60 + 0.01t | inlier |
| 30 | 5.50 | 0.60 log units above line | gross outlier |
| locked consensus | indexes 0,10,20 | OLS slope 0.01 | one refit; membership does not drift |
Use three log-price pivots (0, 4.60), (10, 4.70), and
(20, 4.80), plus a gross outlier (30, 5.50). The first three support
z = 4.60 + 0.01t with zero residual. A sufficiently tight tolerance excludes
the fourth point. Ordinary least squares on all four would rotate the line;
consensus fitting preserves the three-point structure and labels the outlier.
Work through the trace without calling the implementation. Independent arithmetic is the only way to catch a program that is consistently wrong in both languages.
From data to a publishable object
The diagram has one deliberate shape: validate, calculate only from available evidence, publish diagnostics, and preserve the rejection branch.
The algorithm proceeds as follows:
- Consume only confirmed high pivots or only confirmed low pivots.
- Retain the most recent max_points and transform positive prices to log space.
- Enumerate every distinct two-point hypothesis deterministically.
- Count inclusive residual inliers and choose maximum consensus, then minimum median residual, absolute slope, and earliest pair.
- Refit ordinary least squares on the selected inliers and publish diagnostics.
The pseudocode and implementations preserve this ordering so a reconciliation log can identify the first divergent step.
What must remain true
- Only confirmed pivots of one kind enter one fit.
- Every distinct event-index pair proposes at most one hypothesis.
- Residual equality is an inlier.
- The winning membership is locked before the OLS refit.
- Fewer than min inliers returns no fit instead of false precision.
- Residual bps use the exact inverse log transform.
These properties are more useful than a screenshot test. They describe behavior across canonical, boundary, failure, and revised inputs.
See the decision boundary move
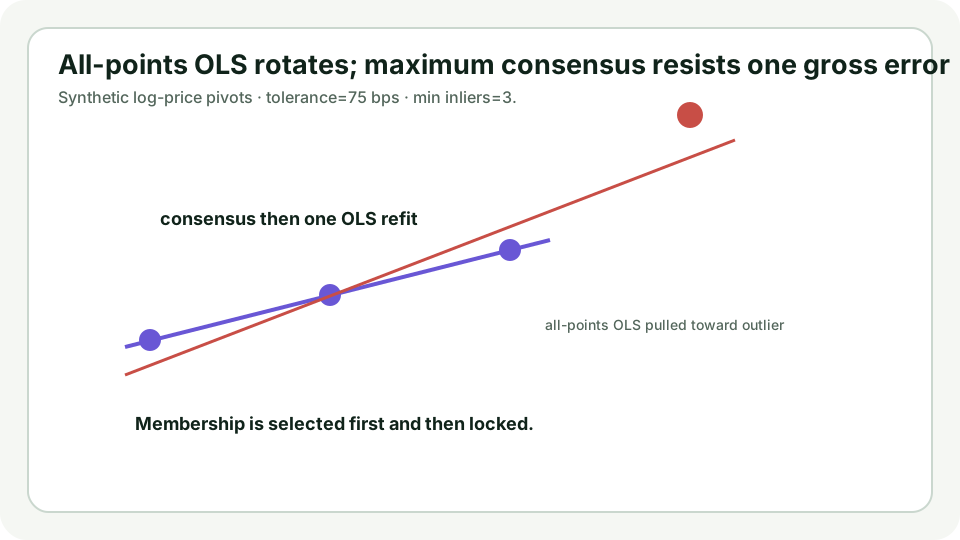
Compare all-points OLS with consensus on the gross-outlier scenario, then reduce max points during a regime shift. Observe that outlier resistance and regime adaptation are different problems. A changed answer after a parameter change is not automatically a bug; an undocumented parameter change is.
Eight experiments instead of one perfect chart
| Experiment | Question to answer |
|---|---|
| Clean alternating swings | A clean control for confirmation latency and alternating structure. |
| Plateau and equality boundaries | Equal extrema expose the selected earliest-plateau and strict-update policies. |
| Noisy micro-swings | Noise reveals sensitivity to span, reversal, density, and residual thresholds. |
| Repeated level retests | Repeated highs and lows create inspectable support and resistance density. |
| Trend with one gross outlier | One extreme observation distinguishes ordinary fitting from consensus fitting. |
| Level and slope regime shift | A structural shift exposes stale clusters, provisional pivots, and window dependence. |
| Competing slope consensuses | Two regimes expose the deterministic maximum-consensus and tie-break contract. |
| Curvature rejects a straight-line story | A visibly smooth path can still lack enough collinear pivots for a trustworthy straight fit. |
Each scenario contains 300 observations and eight checkpoints. The lab starts at an informative state, hides future observations, exposes the current formula trace, and lets you change the parameters without deleting the full fixture.
Open the Robust Trendline Fitting guided lab.
Use the lab in four passes:
- Predict the next state before pressing Step.
- Compare the event index with the knowledge index.
- Move one parameter across its boundary and explain the changed branch.
- Switch to the failure scenario and identify why “no result” is correct.
Where implementations fail
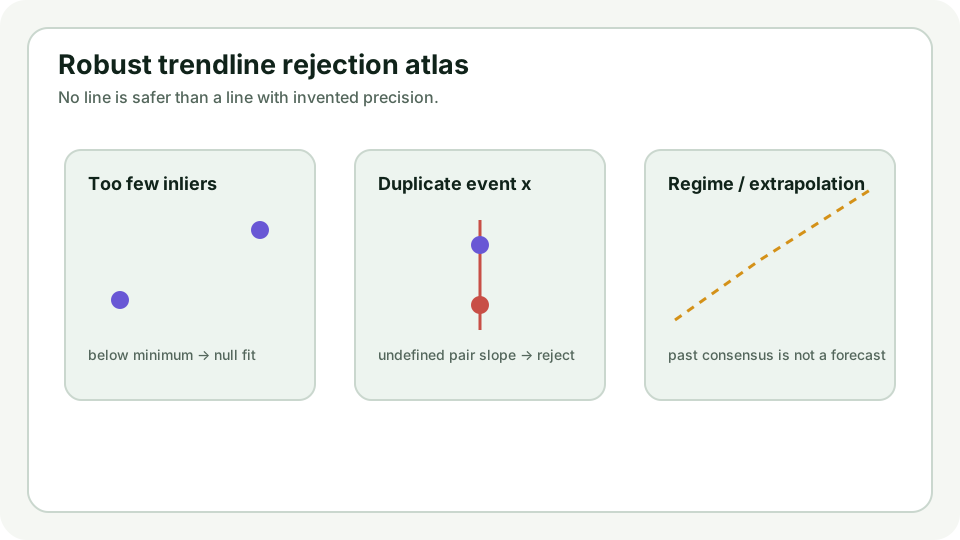
- Fewer than min_inliers returns no line instead of inventing precision.
- Duplicate event indexes are invalid for a two-point slope.
- A point exactly at the residual threshold is an inlier.
- A regime shift can make the old consensus stale; max_points bounds that memory but does not solve regime detection.
- Projection is line evaluation, not evidence that price will travel there.
The principal misuse is Choosing pivots or tolerance after seeing the desired line, or labeling a descriptive extrapolation as a forecast. Detection correctness is separate from historical association, and historical association is separate from value after costs, bias controls, and out-of-sample testing.
Python, TypeScript, and reconciliation
The Python and TypeScript references consume the same declared semantics.
Tests cover the canonical trace, exact boundaries, invalid states, temporal
ordering, deterministic choices, and the enriched fixture shape. Numeric
results use 1e-9; kinds, indexes, memberships, nulls, and rejection behavior
are exact.
When production implementations disagree, compare source identity and adjustment basis first, parameters second, and the earliest intermediate state third. Comparing only final chart lines hides the actual defect.
How the family fits together
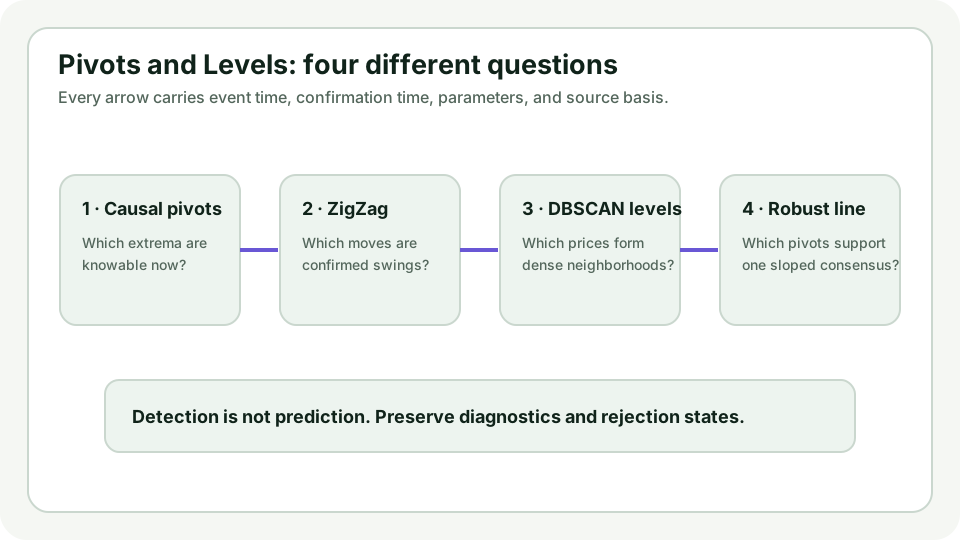
Causal pivots provide honest extrema. ZigZag provides alternating swing compression. Support/resistance clustering provides horizontal density. Robust trendline fitting provides sloped consensus. Each stage answers a different question and must preserve upstream confirmation time.
The next tutorial is Double Top.
Evidence and historical boundary
The historical-example decision is not useful. The synthetic paths isolate the mechanism more cleanly than a selected security chart. A named case would require licensed point-in-time OHLC, verified identity, session and adjustment basis, frozen parameters, finality, and a separate empirical design.
This tutorial establishes implementation agreement and intended detection. It does not establish prediction, causation, profitability, or investment suitability.
Primary sources
- Original RANSAC paper — minimal hypotheses and gross-error consensus.
- scikit-learn RANSAC 1.9.0 — inclusive residual threshold and maintained comparison.
- NIST least squares — OLS form, outlier sensitivity, and extrapolation limits.
The canonical README, reference record, and claim ledger contain the complete definition and evidence classifications.
Rendered from the canonical Mermaid sources linked by this article.
Robust Trendline Fitting calculation flow
Purpose: preserve validation, causal availability, decision branches, and diagnostics in the order used by the implementation.
Takeaway: a rejected or unavailable result is part of the output contract; it must not be filled with retrospective geometry.
ReferencesPrimary sources and evidence notesExpand the source trail, evidence role, and limitations behind the engineering choices.
Expand the source trail, evidence role, and limitations behind the engineering choices.
RANSAC_PAPER — Random Sample Consensus: A Paradigm for Model Fitting
- Organization or authors: Martin A. Fischler and Robert C. Bolles
- Source type: Original 1981 ACM paper
- Publication or effective date: June 1981
- Version: Communications of the ACM 24(6), DOI 10.1145/358669.358692
- URL: https://graphics.stanford.edu/courses/cs233-25-spring/ReferencedPapers/ransac.pdf
- Accessed: 2026-07-27
- Jurisdiction: technical; not jurisdiction-specific
- Supports: Model hypotheses from minimal samples and consensus-based resistance to gross errors.
- Limitations: The original applications are image analysis and cartography, not financial trendlines.
- Evidence role: sourced algorithm or maintained-library behavior; the financial application remains a package choice.
- Publication boundary: no provider observation, historical return, causal outcome, or profitability claim.
SKLEARN_RANSAC — sklearn.linear_model.RANSACRegressor
- Organization or authors: scikit-learn project
- Source type: Maintained official library documentation
- Publication or effective date: Maintained documentation
- Version: scikit-learn 1.9.0
- URL: https://scikit-learn.org/stable/modules/generated/sklearn.linear_model.RANSACRegressor.html
- Accessed: 2026-07-27
- Jurisdiction: technical; not jurisdiction-specific
- Supports: Residual thresholds, inclusive equality, inlier masks, refitting, stopping, and deterministic random-state guidance.
- Limitations: This package enumerates every two-point hypothesis, avoiding random sampling for small pivot sets.
- Evidence role: sourced algorithm or maintained-library behavior; the financial application remains a package choice.
- Publication boundary: no provider observation, historical return, causal outcome, or profitability claim.
NIST_LS — Linear Least Squares Regression
- Organization or authors: NIST/SEMATECH
- Source type: Official engineering statistics handbook
- Publication or effective date: NIST/SEMATECH e-Handbook
- Version: Handbook page current on 2026-07-27
- URL: https://www.itl.nist.gov/div898/handbook/pmd/section1/pmd141.htm
- Accessed: 2026-07-27
- Jurisdiction: technical; not jurisdiction-specific
- Supports: Linear least-squares form, usefulness, assumptions, outlier sensitivity, and extrapolation limitations.
- Limitations: A fitted trendline remains a descriptive model, not a price forecast.
- Evidence role: sourced algorithm or maintained-library behavior; the financial application remains a package choice.
- Publication boundary: no provider observation, historical return, causal outcome, or profitability claim.
TV_REPAINT — Pine Script Concepts: Repainting
- Organization or authors: TradingView
- Source type: Maintained official platform documentation
- Publication or effective date: Maintained documentation
- Version: Pine Script v6 concepts page current on 2026-07-27
- URL: https://www.tradingview.com/pine-script-docs/concepts/repainting/
- Accessed: 2026-07-27
- Jurisdiction: technical; not jurisdiction-specific
- Supports: A pivot plotted back on its event bar is only discovered after right-side bars have elapsed and can mislead if knowledge time is hidden.
- Limitations: The page explains platform display behavior, not the financial usefulness of pivots.
- Evidence role: sourced algorithm or maintained-library behavior; the financial application remains a package choice.
- Publication boundary: no provider observation, historical return, causal outcome, or profitability claim.
Full dependency-light reference implementations in both supported languages.
export type Bar = { timestamp: string; high: number; low: number; close: number };
export type Pivot = { kind: "high" | "low"; event_index: number; confirmation_index: number; price: number; separation?: number; latency?: number };

function finite(value: number): boolean { return Number.isFinite(value); }
function validateBars(bars: Bar[]): void {
  if (!Array.isArray(bars) || bars.length === 0) throw new Error("bars must be a non-empty array");
  let previous = "";
  bars.forEach((bar, index) => {
    if (![bar.high, bar.low, bar.close].every(finite)) throw new Error(`bar ${index} contains a non-finite price`);
    if (bar.high < bar.low || bar.close < bar.low || bar.close > bar.high) throw new Error(`bar ${index} violates OHLC ordering`);
    if (!bar.timestamp || (previous && bar.timestamp <= previous)) throw new Error("timestamps must be strictly increasing");
    previous = bar.timestamp;
  });
}
function validatePivots(pivots: Pivot[]): void {
  if (!Array.isArray(pivots)) throw new Error("pivots must be an array");
  const identities = new Set<string>();
  pivots.forEach((pivot, index) => {
    if (pivot.kind !== "high" && pivot.kind !== "low") throw new Error(`pivot ${index} kind must be high or low`);
    if (!Number.isInteger(pivot.event_index) || pivot.event_index < 0) throw new Error(`pivot ${index} event_index must be an integer >= 0`);
    if (!Number.isInteger(pivot.confirmation_index) || pivot.confirmation_index < pivot.event_index) throw new Error(`pivot ${index} confirmation_index must be >= event_index`);
    if (!finite(pivot.price) || pivot.price <= 0) throw new Error(`pivot ${index} price must be finite and > 0`);
    const identity = `${pivot.kind}:${pivot.event_index}`;
    if (identities.has(identity)) throw new Error("same-kind pivot event indexes must be unique");
    identities.add(identity);
  });
}

export function detectCausalPivots(bars: Bar[], leftSpan = 3, rightSpan = 3, minSeparation = 0): Pivot[] {
  validateBars(bars);
  if (!Number.isInteger(leftSpan) || leftSpan < 1 || !Number.isInteger(rightSpan) || rightSpan < 1) throw new Error("spans must be integers >= 1");
  if (!finite(minSeparation) || minSeparation < 0) throw new Error("minSeparation must be finite and >= 0");
  const events: Pivot[] = [];
  for (let i = leftSpan; i < bars.length - rightSpan; i += 1) {
    const left = bars.slice(i - leftSpan, i), right = bars.slice(i + 1, i + rightSpan + 1);
    const leftHigh = Math.max(...left.map(b => b.high)), rightHigh = Math.max(...right.map(b => b.high));
    const leftLow = Math.min(...left.map(b => b.low)), rightLow = Math.min(...right.map(b => b.low));
    const highMargin = bars[i].high - Math.max(leftHigh, rightHigh);
    const lowMargin = Math.min(leftLow, rightLow) - bars[i].low;
    if (bars[i].high > leftHigh && bars[i].high >= rightHigh && highMargin + 1e-12 >= minSeparation)
      events.push({kind:"high", event_index:i, confirmation_index:i+rightSpan, price:bars[i].high, separation:highMargin, latency:rightSpan});
    if (bars[i].low < leftLow && bars[i].low <= rightLow && lowMargin + 1e-12 >= minSeparation)
      events.push({kind:"low", event_index:i, confirmation_index:i+rightSpan, price:bars[i].low, separation:lowMargin, latency:rightSpan});
  }
  return events.sort((a,b) => a.confirmation_index-b.confirmation_index || a.event_index-b.event_index || a.kind.localeCompare(b.kind));
}

export function fitRobustTrendline(pivots: Pivot[], kind:"high"|"low"="low", toleranceBps=75, minInliers=3, maxPoints=12, projectionIndex?:number) {
  validatePivots(pivots);
  if(!(toleranceBps>0)||!Number.isInteger(minInliers)||minInliers<3||!Number.isInteger(maxPoints)||maxPoints<minInliers)throw new Error("invalid fit parameters");
  const selected=pivots.filter(p=>p.kind===kind).sort((a,b)=>a.confirmation_index-b.confirmation_index||a.event_index-b.event_index).slice(-maxPoints);
  if(selected.length<minInliers)return null;
  const pts=selected.map(p=>[p.event_index,Math.log(p.price)] as [number,number]), eps=Math.log1p(toleranceBps/10000);
  let best:{score:number[]; inliers:number[]}|null=null;
  const less=(a:number[],b:number[])=>a.some((value,index)=>value<b[index]&&a.slice(0,index).every((prior,j)=>prior===b[j]));
  for(let a=0;a<pts.length;a++)for(let b=a+1;b<pts.length;b++){if(pts[a][0]===pts[b][0])continue;const slope=(pts[b][1]-pts[a][1])/(pts[b][0]-pts[a][0]), intercept=pts[a][1]-slope*pts[a][0];
    const ins=pts.map((p,i)=>[i,Math.abs(p[1]-(intercept+slope*p[0]))] as [number,number]).filter(x=>x[1]<=eps+1e-15);if(ins.length<minInliers)continue;const sorted=ins.map(x=>x[1]).sort((x,y)=>x-y), med=sorted.length%2?sorted[(sorted.length-1)/2]:(sorted[sorted.length/2-1]+sorted[sorted.length/2])/2, score=[-ins.length,med,Math.abs(slope),a,b];
    if(!best||less(score,best.score))best={score,inliers:ins.map(x=>x[0])};}
  if(!best)return null; const fit=(ids:number[])=>{const xm=ids.reduce((s,i)=>s+pts[i][0],0)/ids.length,ym=ids.reduce((s,i)=>s+pts[i][1],0)/ids.length,den=ids.reduce((s,i)=>s+(pts[i][0]-xm)**2,0);const slope=ids.reduce((s,i)=>s+(pts[i][0]-xm)*(pts[i][1]-ym),0)/den;return {slope,intercept:ym-slope*xm};};
  const model=fit(best.inliers), project=projectionIndex??Math.max(...pts.map(p=>p[0]))+1;
  const residualBps=best.inliers.map(i=>Math.expm1(Math.abs(pts[i][1]-(model.intercept+model.slope*pts[i][0])))*10000).sort((a,b)=>a-b);
  const medianResidual=residualBps.length%2?residualBps[(residualBps.length-1)/2]:(residualBps[residualBps.length/2-1]+residualBps[residualBps.length/2])/2;
  return {kind,slope_log_per_bar:model.slope,intercept_log:model.intercept,projected_index:project,projected_price:Math.exp(model.intercept+model.slope*project),inlier_count:best.inliers.length,outlier_count:pts.length-best.inliers.length,median_absolute_residual_bps:medianResidual,inlier_event_indexes:best.inliers.map(i=>selected[i].event_index),source_pivot_count:pts.length};
}
The embedded lab now expands to its full document height, keeping the article as the only scroll surface.