
 By Islam Baraka
Build and audit the original five-factor Altman score without silently substituting Z-prime, Z-double-prime, or a modern probability of default.
The decision this tutorial makes visible
Altman Z-Score matters because a compact score can organize a review queue, but only when its accounting definitions, original estimation population, availability clock, and interpretation boundary remain visible.
The precise question is: How does the original 1968 public-manufacturer model combine liquidity, retained profitability, operating return, market leverage, and turnover into one distress zone?
A practitioner needs to know what the diagnostic does and does not justify. A builder needs a contract that can be reproduced from the same point-in-time inputs in Python, TypeScript, a visual, and a browser lab.
Intuition before notation
Each term contributes a different balance-sheet or operating dimension; the sum is meaningful only under the original coefficient and population convention.
The result depends on the declared algorithm scope, input clocks, units, equality and rounding policies, and unsupported-state treatment. Change one of those and the output represents a different decision even when its field name is unchanged.
Scope and nearby methods
Original 1968 five-ratio linear discriminant score for publicly traded manufacturers; market value of equity is divided by book total liabilities.
| Variant | Definition | Best use | Main limitation |
|---|---|---|---|
| Original Z | Five factors including MVE/TL and sales/TA | Public manufacturers | Historical calibration |
| Z-prime | Private-firm coefficient set with book equity | Private manufacturers | Not this equation |
| Z-double-prime | Four-factor nonmanufacturing/emerging-market family | Broader sector studies | Not interchangeable |
What is sourced, selected, synthetic, and derived
| Role | Material claim | Evidence | Boundary |
|---|---|---|---|
| Sourced fact | Defines the discriminant-analysis setting, five ratios, coefficients, and original sample context. | S1 original or explicitly limited reproduction | Later variants for private, nonmanufacturing, and emerging-market firms are different models; the historical sample does not guarantee current calibration. |
| Implementation choice | Original 1968 five-ratio linear discriminant score for publicly traded manufacturers; market value of equity is divided by book total liabilities. | Frozen definition contract, code, fixtures, and parity tests | Nearby coefficient sets and variants remain separate. |
| Synthetic teaching input | All company records, periods, peer samples, scenarios, and outputs are repository-authored synthetic data. | datasets/canonical-input.json and scenario-results.json | No value is an observed issuer or provider record. |
| Author-derived calculation | The synthetic ratios are 0.20, 0.30, 0.16, 1.40, and 1.20. Their contributions sum to 3.228, placing the record above the original 2.99 safe-zone boundary. | Formula, expected-output.json, independent checks, and Python/TypeScript parity | Arithmetic fidelity does not validate prediction or company conclusions. |
| Scope boundary | The output does not establish a current issuer conclusion, audit finding, rating, default forecast, investment return, or causal claim. | No empirical current-population or advisory claim is tested | Use as a documented screen or research measure only. |
The authoritative sources support only the exact facts named in the claim ledger. They do not certify the synthetic numbers in this tutorial. The repository fixture is deliberately invented for auditability, and the displayed output is author-derived under the selected implementation choice.
Formula, symbols, and numerical policy
Z = 1.2(WC/TA) + 1.4(RE/TA) + 3.3(EBIT/TA) + 0.6(MVE/TL) + 1.0(Sales/TA)
| Symbol | Meaning | Unit | Policy |
|---|---|---|---|
| WC | Working capital | currency | CA minus CL |
| RE | Retained earnings | currency | Filed/mapped cumulative balance |
| MVE | Market value of equity | currency | Observation time required |
| TL | Book total liabilities | currency | Not market debt |
- Use full floating-point precision and round only for display.
- Ratios are dimensionless unless a days or currency-scale contract is explicit.
- Reject missing, nonfinite, boolean-as-number, zero-denominator, invalid-log, singular-regression, mixed-period, or unsupported records.
- Keep the raw index, transformation, contribution vector, threshold policy, and diagnostic state together.
Read the formula in the same order as the algorithm. Validate identity, ordering, units, and supported state first. Apply the selected equality, cutoff, and estimation rules second. Calculate with unrounded numeric values. Round only at the declared presentation boundary, and preserve null as a diagnostic rather than coercing it to zero.
Build the algorithm
- Validate public-manufacturer scope and point-in-time inputs.
- Calculate the five ratios without rounding.
- Apply the original coefficients and reconcile contributions.
- Assign distress, grey, or safe zone under the frozen thresholds.
Production-minded operational checklist
- Confirm model variant and original population
- Map every accounting input and clock
- Reconcile score contributions
- Treat the output as a review screen, not a conclusion
Stop when a required line item, filing clock, unit scale, original-population condition, or estimation sample is unavailable; do not manufacture precision from a familiar score name.
Worked synthetic example
The canonical fixture is synthetic teaching data, not an observed issuer, filing, audit case, or market outcome. Its primary author-derived output,
z_score, is five ratios, five contributions, Z = 3.228, and the original safe-zone label. The complete input and output
are in datasets/canonical-input.json and datasets/expected-output.json.
The synthetic ratios are 0.20, 0.30, 0.16, 1.40, and 1.20. Their contributions sum to 3.228, placing the record above the original 2.99 safe-zone boundary.
Counterfactual checkpoint
One-driver stress. Move one declared accounting driver while holding the remaining synthetic record fixed. The output changes because The score is a weighted mapping of the frozen inputs, not an independent fact.
The structured result retains state and diagnostics in addition to the primary number. That makes the calculation independently reviewable and prevents an incomplete, rejected, unsupported, or retrospective result from being mistaken for an unqualified conclusion.
Boundary and counterexample workbook
The playground computes every scenario at 61 deterministic parameter states.
The table uses the declared focus step and states whether that focus reproduces
the canonical fixture. The full state ledger and compressed transition
segments are in datasets/scenario-results.json.
| Scenario | Review focus | Purpose | State | Primary output | Diagnostic | Decision segments |
|---|---|---|---|---|---|---|
| Canonical EBIT contribution | Step 30 · canonical fixture | Driver: ebit. Sweep EBIT while keeping the other four ratios fixed. Predict: Will a higher EBIT/TA contribution lift Z? | calculated | 3.2280 | calculated · safe-zone · altman-1968-public-manufacturer | 1 |
| Retained-earnings history | Step 30 · canonical fixture | Driver: retained_earnings. Sweep retained earnings to isolate the accumulated-profitability ratio. Predict: Will retained earnings move the score through the 1.4 coefficient? | calculated | 3.2280 | calculated · safe-zone · altman-1968-public-manufacturer | 1 |
| Working-capital liquidity | Step 30 · canonical fixture | Driver: working_capital. Sweep working capital and observe the 1.2 liquidity contribution. Predict: Will more working capital move the firm toward the safe side? | calculated | 3.2280 | calculated · safe-zone · altman-1968-public-manufacturer | 1 |
| Market-equity cushion | Step 30 · canonical fixture | Driver: market_value_equity. Sweep market value of equity against unchanged liabilities. Predict: Will market leverage change the score even when accounting liabilities stay fixed? | calculated | 3.2280 | calculated · safe-zone · altman-1968-public-manufacturer | 1 |
| Asset-scale denominator | Step 30 · canonical fixture | Driver: total_assets. Sweep total assets to expose denominator sensitivity across three ratios. Predict: Which contribution changes fastest when the common asset denominator moves? | calculated | 3.2280 | calculated · safe-zone · altman-1968-public-manufacturer | 1 |
| Liability denominator | Step 30 · canonical fixture | Driver: total_liabilities. Sweep total liabilities to isolate the market-equity-to-liabilities ratio. Predict: Will a larger liability base reduce the market-value contribution? | calculated | 3.2280 | calculated · safe-zone · altman-1968-public-manufacturer | 1 |
| Sales turnover | Step 30 · canonical fixture | Driver: sales. Sweep sales to isolate the sales-to-assets contribution. Predict: Will turnover move Z without changing liquidity or profitability ratios? | calculated | 3.2280 | calculated · safe-zone · altman-1968-public-manufacturer | 1 |
These rows are not backtest observations. They are controlled counterexamples that expose how one driver changes the state, output, or reason code while the rest of the contract stays fixed.
Visualize the boundary

Open this SVG at full size, or use the guided playground to compare the seven topic-specific canonical, boundary, policy, and failure scenarios.
The Mermaid flow answers where the selected calculation sits in the processing sequence. The SVG keeps the formula, output, decision boundary, and invariant visible together. The lab lets the reader step through the same structured states without changing the underlying definition.
Implementation walkthrough
The Python and TypeScript references begin with the same validation contract, reject malformed and unsupported state before calculation, preserve declared ordering and rounding policies, and return structured diagnostics rather than one context-free number.
The main implementation branches are:
- Z < 1.81 — Label original distress zone, because Below the original lower cutoff.
- 1.81 <= Z <= 2.99 — Label grey zone, because Inclusive equality policy.
- Z > 2.99 — Label original safe zone, because Above the original upper cutoff.
Neither reference silently fetches data, mutates caller-owned inputs outside the declared engine behavior, guesses hidden state, or substitutes a provider default. Shared JSON fixtures make value, null, state, and reason-code drift visible across languages.
Testing and validation
Definition tests compare every canonical field, reject malformed state, and exercise the material boundary. Family validation recomputes every playground state from the reference function. Independent arithmetic is recorded beside the fixture rather than inferred only from implementation output.
The audit must preserve these invariants:
- Z exactly equals the sum of five displayed contributions.
- At 1.81 and 2.99 the package retains the grey zone.
- Replacing MVE with book equity creates a different model.
- The output retains named predictors/components, raw score, screen or residual interpretation, and method identifier.
Passing checks proves the selected equation, mapping, scenario, and language parity. It does not validate out-of-sample classification performance.
Failure modes and misuse
- The model can be stale, population-specific, industry-sensitive, and affected by accounting classification or business-model changes.
- A threshold crossing is a screen for further review, not bankruptcy, fraud, audit, rating, or valuation evidence by itself.
- Implementation fidelity does not prove predictive accuracy, causality, market usefulness, or suitability for a current jurisdiction.
Debugging order
When a result looks surprising, inspect the state in this order:
- Confirm the exact model variant and coefficients.
- Confirm filing availability and accounting mapping.
- Confirm units, scale, signs, periods, logs, and denominators.
- Reconcile each contribution or regression residual before interpreting the aggregate.
Evidence and historical boundary
Historical decision: not useful. A named issuer is not useful for the canonical arithmetic because a defensible case would require the exact filing version available at the decision date, a line-item mapping ledger, restatement and corporate-action treatment, model-population eligibility, coefficient provenance, and independently reproducible arithmetic. Original research samples establish model history; synthetic records isolate mechanics without alleging distress or misstatement by a real company.
The primary sources are Altman (1968), SEC financial-statement guide, IFRS Conceptual Framework. They support the source roles listed in the research ledger, not a redistributable historical observation, a current issuer conclusion, audit finding, rating, default forecast, investment return, or causal claim
Summary and next topic
You can now calculate, audit, and bound Altman Z-Score before continuing to Piotroski F-Score. The learning flow is: Common-Size Statements → Altman Z-Score → Piotroski F-Score. Carry the result forward only with its scope, clock, state, and evidence label.
Deep visual atlas
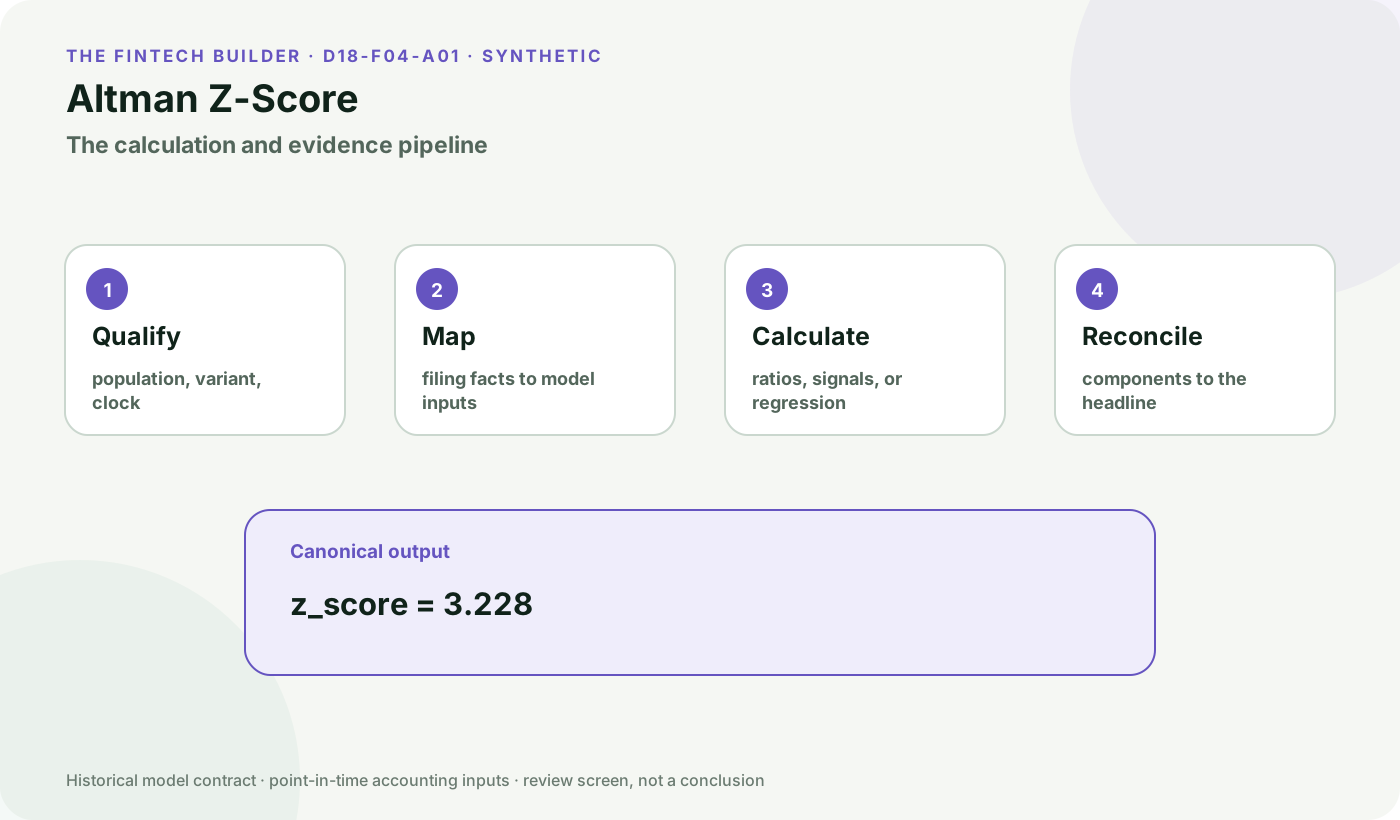
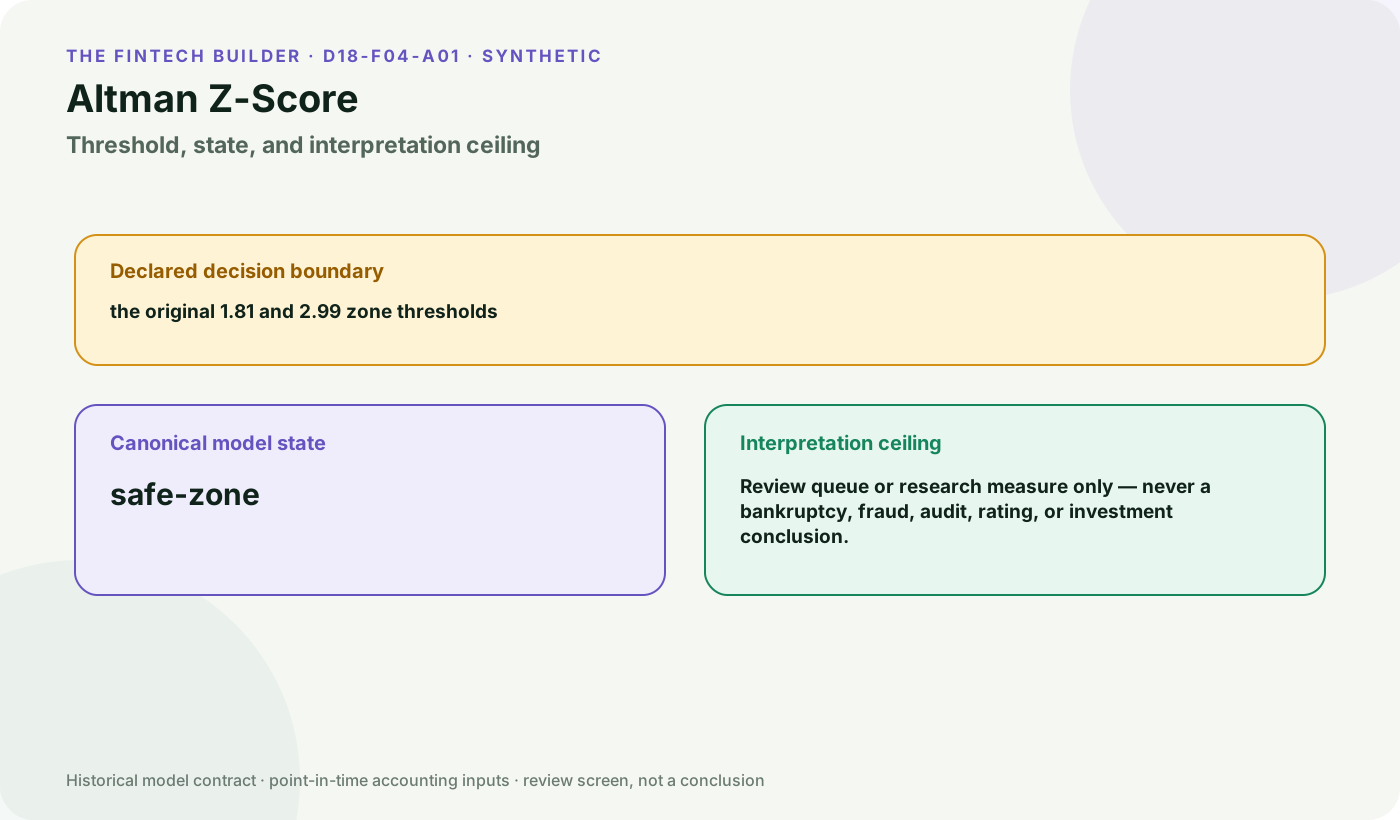
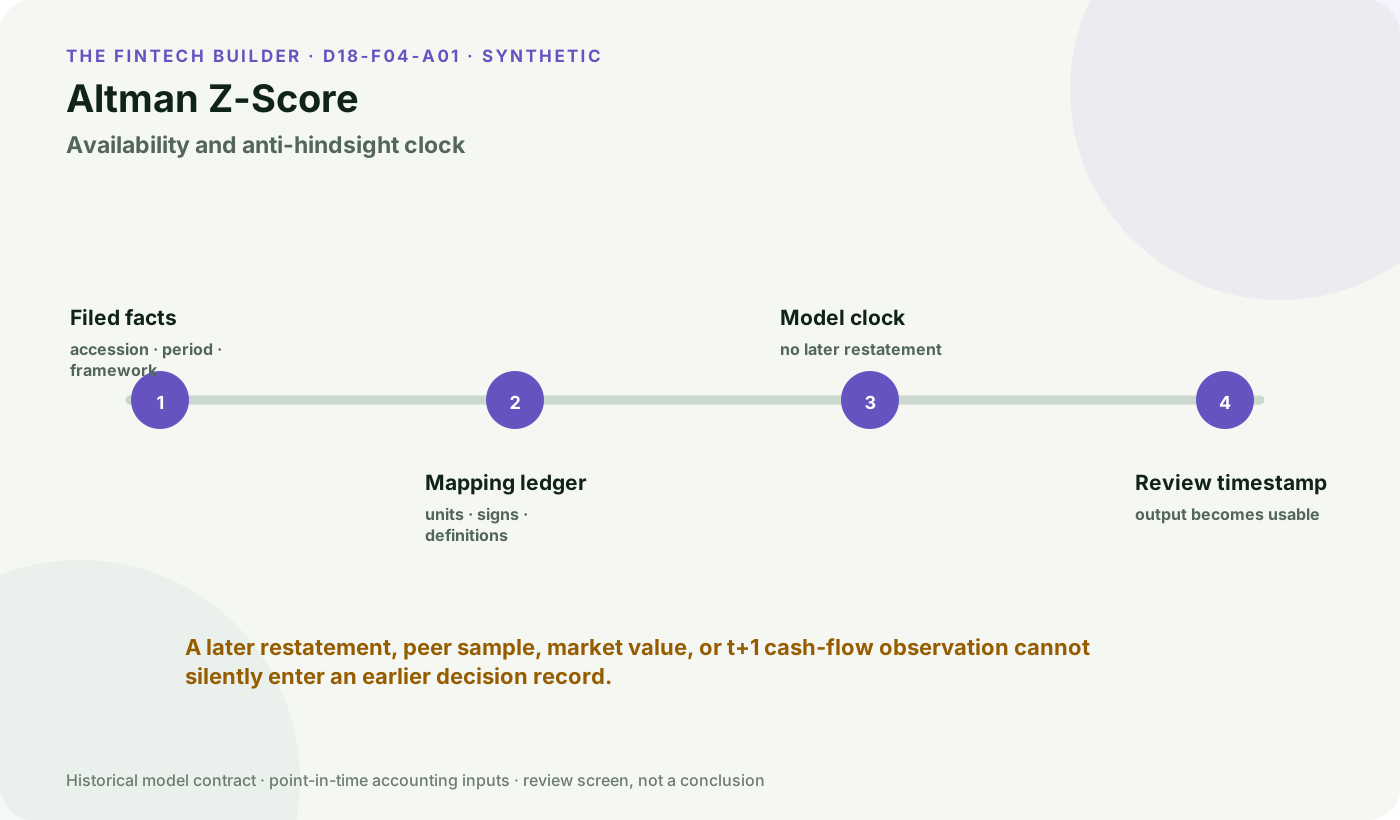
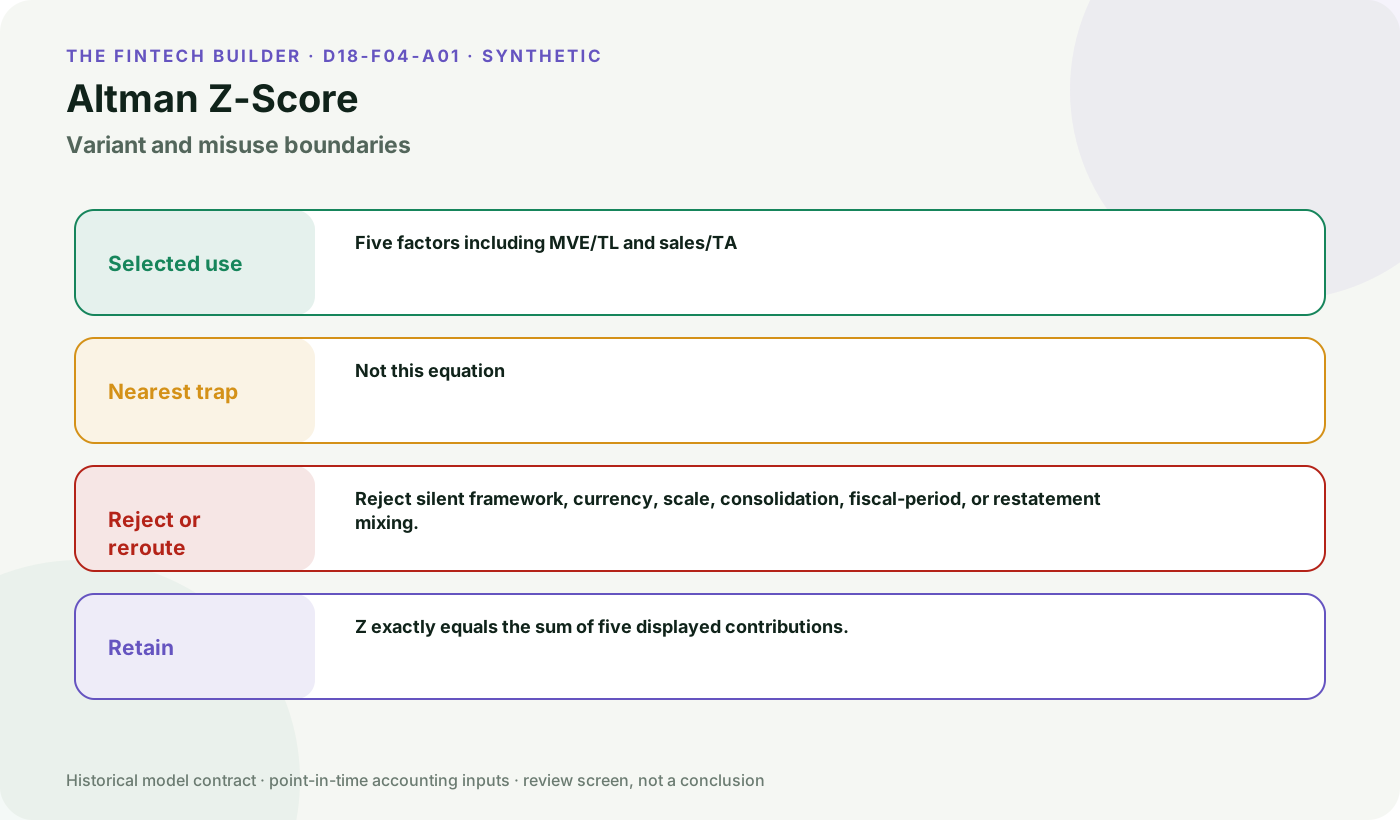
Use the anatomy to reconstruct the score, the threshold map to preserve equality and interpretation, the clock to prevent hindsight, and the boundary map to stop variant drift.
Use the accounting studio
- Read the prediction prompt and name the direction before moving the state slider.
- Check the driver under test and compare the scenario base with the current state.
- Reconcile the visible intermediate (five ratios and their weighted contributions) to the headline.
- Apply the boundary and evidence clock: the original 1.81 and 2.99 zone thresholds.
| Visual | Question it answers | Studio handoff |
|---|---|---|
| Model anatomy | What is the calculation order? | Start with Qualify → Map → Calculate → Reconcile. |
| Threshold and interpretation | What does equality mean? | Move to the boundary scenario and read the interpretation ceiling. |
| Evidence clock | What was knowable at the decision time? | For A12, wait for future CFO; for A13, freeze the peer sample. |
| Variant boundaries | Which nearby model is not interchangeable? | Compare the active driver with the claim ledger before changing the model. |
Rendered from the canonical Mermaid sources linked by this article.
Altman Z-Score calculation flow
This flow identifies the selected calculation stages and the structured output.
Takeaway: The aggregate is a transparent contribution bridge; the market-equity and sales terms make model-variant selection visible.
ReferencesPrimary sources and evidence notesExpand the source trail, evidence role, and limitations behind the engineering choices.
Expand the source trail, evidence role, and limitations behind the engineering choices.
S1 — Financial Ratios, Discriminant Analysis and the Prediction of Corporate Bankruptcy
- Organization or authors: Edward I. Altman
- Source type: Original peer-reviewed paper
- Publication or effective date: 1968
- Version: Original publication or cited edition
- URL or DOI: https://doi.org/10.1111/j.1540-6261.1968.tb00843.x
- Accessed: 2026-08-06
- Jurisdiction: U.S. publicly traded manufacturers in the original sample
- Supports: Defines the discriminant-analysis setting, five ratios, coefficients, and original sample context.
- Limitations: Later variants for private, nonmanufacturing, and emerging-market firms are different models; the historical sample does not guarantee current calibration.
S2 — Beginners' Guide to Financial Statements
- Organization or authors: U.S. Securities and Exchange Commission
- Source type: Official regulator publication
- Publication or effective date: 2007-02-05
- Version: Original publication or cited edition
- URL or DOI: https://www.sec.gov/about/reports-publications/investor-publications/beginners-guide-financial-statements
- Accessed: 2026-08-06
- Jurisdiction: United States public-company reporting
- Supports: Balance sheets describe a point in time, income and cash-flow statements describe a period, and the notes are integral to interpretation.
- Limitations: It does not prescribe any score, line-item mapping, coefficient, cutoff, or empirical conclusion.
S3 — Conceptual Framework for Financial Reporting
- Organization or authors: International Accounting Standards Board
- Source type: Official accounting framework
- Publication or effective date: 2021 issued compilation
- Version: Original publication or cited edition
- URL or DOI: https://www.ifrs.org/content/dam/ifrs/publications/pdf-standards/english/2021/issued/part-a/conceptual-framework-for-financial-reporting.pdf
- Accessed: 2026-08-06
- Jurisdiction: IFRS reporting
- Supports: Financial-statement elements and measurement are framework-dependent and must be interpreted with presentation and disclosure context.
- Limitations: It does not endorse legacy distress or earnings-quality coefficient sets.
Evidence boundary
The original research source establishes the named historical model and research context. It does not certify this synthetic fixture, a current population calibration, or a company conclusion. SEC/IFRS sources establish statement context only.
Full dependency-light reference implementations in both supported languages.
/** Canonical TypeScript reference for D18-F04 Quality and Distress. */

type RecordValue = Record<string, unknown>;

function objectValue(data: RecordValue, name: string): RecordValue {
  const value = data[name];
  if (!value || typeof value !== "object" || Array.isArray(value)) throw new TypeError(`${name} must be an object`);
  return value as RecordValue;
}

function numberValue(data: RecordValue, name: string): number {
  const value = data[name];
  if (typeof value !== "number" || !Number.isFinite(value)) throw new TypeError(`${name} must be a finite number`);
  return value;
}

function positive(data: RecordValue, name: string): number {
  const value = numberValue(data, name);
  if (value <= 0) throw new RangeError(`${name} must be positive`);
  return value;
}

function nonnegative(data: RecordValue, name: string): number {
  const value = numberValue(data, name);
  if (value < 0) throw new RangeError(`${name} must be nonnegative`);
  return value;
}

function booleanValue(data: RecordValue, name: string): boolean {
  const value = data[name];
  if (typeof value !== "boolean") throw new TypeError(`${name} must be a boolean`);
  return value;
}

function ratio(numerator: number, denominator: number, name: string): number {
  if (denominator === 0) throw new RangeError(`${name} denominator must be nonzero`);
  return numerator / denominator;
}

function logistic(index: number): number {
  if (index >= 0) { const z = Math.exp(-index); return 1 / (1 + z); }
  const z = Math.exp(index); return z / (1 + z);
}

function normalCdf(value: number): number {
  const sign = value < 0 ? -1 : 1;
  const x = Math.abs(value) / Math.sqrt(2);
  const t = 1 / (1 + 0.3275911 * x);
  const polynomial = (((((1.061405429 * t - 1.453152027) * t) + 1.421413741) * t - 0.284496736) * t + 0.254829592) * t;
  const erfValue = sign * (1 - polynomial * Math.exp(-x * x));
  return 0.5 * (1 + erfValue);
}

function sum(values: Record<string, number>): number { return Object.values(values).reduce((a, b) => a + b, 0); }

function altman(data: RecordValue): RecordValue {
  const assets = positive(data, "total_assets"), liabilities = positive(data, "total_liabilities");
  const ratios = {
    working_capital_to_assets: numberValue(data, "working_capital") / assets,
    retained_earnings_to_assets: numberValue(data, "retained_earnings") / assets,
    ebit_to_assets: numberValue(data, "ebit") / assets,
    market_equity_to_liabilities: nonnegative(data, "market_value_equity") / liabilities,
    sales_to_assets: numberValue(data, "sales") / assets,
  };
  const contributions = {
    working_capital: 1.2 * ratios.working_capital_to_assets,
    retained_earnings: 1.4 * ratios.retained_earnings_to_assets,
    ebit: 3.3 * ratios.ebit_to_assets,
    market_equity: 0.6 * ratios.market_equity_to_liabilities,
    sales: ratios.sales_to_assets,
  };
  const score = sum(contributions);
  const zone = score < 1.81 ? "distress-zone" : score > 2.99 ? "safe-zone" : "grey-zone";
  return {state:"calculated",method:"altman-1968-public-manufacturer",ratios,contributions,z_score:score,zone,threshold_policy:"distress<1.81; grey=1.81..2.99; safe>2.99"};
}

function piotroski(data: RecordValue): RecordValue {
  const beginAssets=positive(data,"beginning_total_assets"), priorBeginAssets=positive(data,"prior_beginning_total_assets");
  const currentAssets=positive(data,"current_assets"), currentLiabilities=positive(data,"current_liabilities");
  const priorCurrentAssets=positive(data,"prior_current_assets"), priorCurrentLiabilities=positive(data,"prior_current_liabilities");
  const sales=positive(data,"sales"), priorSales=positive(data,"prior_sales");
  const netIncome=numberValue(data,"net_income"), priorNetIncome=numberValue(data,"prior_net_income"), cfo=numberValue(data,"operating_cash_flow");
  const roa=netIncome/beginAssets, priorRoa=priorNetIncome/priorBeginAssets;
  const signals = {
    positive_roa: +(roa>0), positive_cfo: +(cfo>0), improving_roa: +(roa>priorRoa), cash_exceeds_income: +(cfo>netIncome),
    lower_leverage: +(numberValue(data,"long_term_debt")/beginAssets < numberValue(data,"prior_long_term_debt")/priorBeginAssets),
    higher_current_ratio: +(currentAssets/currentLiabilities > priorCurrentAssets/priorCurrentLiabilities),
    no_equity_issue: +(nonnegative(data,"equity_issued")===0),
    higher_gross_margin: +(numberValue(data,"gross_profit")/sales > numberValue(data,"prior_gross_profit")/priorSales),
    higher_asset_turnover: +(sales/beginAssets > priorSales/priorBeginAssets),
  };
  const score=sum(signals), band=score<=2?"weak-signals":score>=8?"strong-signals":"mixed-signals";
  return {state:"calculated",method:"piotroski-2000-nine-signal",signals,f_score:score,band,signal_count:9};
}

function beneish(data: RecordValue): RecordValue {
  const sales=positive(data,"sales"), priorSales=positive(data,"prior_sales");
  const receivables=nonnegative(data,"receivables"), priorReceivables=nonnegative(data,"prior_receivables");
  const grossMargin=(sales-numberValue(data,"cost_of_goods_sold"))/sales;
  const priorGrossMargin=(priorSales-numberValue(data,"prior_cost_of_goods_sold"))/priorSales;
  if (grossMargin===0 || priorGrossMargin===0) throw new RangeError("gross margins must be nonzero");
  const assets=positive(data,"total_assets"), priorAssets=positive(data,"prior_total_assets");
  const currentAssetQuality=1-(numberValue(data,"current_assets")+numberValue(data,"net_ppe")+numberValue(data,"securities"))/assets;
  const priorAssetQuality=1-(numberValue(data,"prior_current_assets")+numberValue(data,"prior_net_ppe")+numberValue(data,"prior_securities"))/priorAssets;
  if (priorAssetQuality===0) throw new RangeError("prior asset-quality denominator must be nonzero");
  const depreciationRate=ratio(numberValue(data,"depreciation"),numberValue(data,"net_ppe")+numberValue(data,"depreciation"),"depreciation rate");
  const priorDepreciationRate=ratio(numberValue(data,"prior_depreciation"),numberValue(data,"prior_net_ppe")+numberValue(data,"prior_depreciation"),"prior depreciation rate");
  const indices={
    dsri:ratio(receivables/sales,priorReceivables/priorSales,"DSRI"), gmi:priorGrossMargin/grossMargin,
    aqi:currentAssetQuality/priorAssetQuality, sgi:sales/priorSales, depi:priorDepreciationRate/depreciationRate,
    sgai:ratio(numberValue(data,"sga_expense")/sales,numberValue(data,"prior_sga_expense")/priorSales,"SGAI"),
    lvgi:ratio((numberValue(data,"current_liabilities")+numberValue(data,"long_term_debt"))/assets,(numberValue(data,"prior_current_liabilities")+numberValue(data,"prior_long_term_debt"))/priorAssets,"LVGI"),
    tata:(numberValue(data,"income_from_continuing_operations")-numberValue(data,"operating_cash_flow"))/assets,
  };
  const contributions={intercept:-4.84,dsri:.92*indices.dsri,gmi:.528*indices.gmi,aqi:.404*indices.aqi,sgi:.892*indices.sgi,depi:.115*indices.depi,sgai:-.172*indices.sgai,tata:4.679*indices.tata,lvgi:-.327*indices.lvgi};
  const score=sum(contributions);
  return {state:"calculated",method:"beneish-1999-eight-variable",indices,contributions,m_score:score,screen:score>-1.78?"above-screening-cutoff":"below-screening-cutoff",cutoff:-1.78};
}

function sloan(data: RecordValue): RecordValue {
  const avgAssets=positive(data,"average_total_assets");
  const deltaCa=numberValue(data,"current_assets")-numberValue(data,"prior_current_assets");
  const deltaCash=numberValue(data,"cash")-numberValue(data,"prior_cash");
  const deltaCl=numberValue(data,"current_liabilities")-numberValue(data,"prior_current_liabilities");
  const deltaStd=numberValue(data,"short_term_debt")-numberValue(data,"prior_short_term_debt");
  const deltaTax=numberValue(data,"taxes_payable")-numberValue(data,"prior_taxes_payable");
  const depreciation=nonnegative(data,"depreciation_and_amortization");
  const accrualAmount=(deltaCa-deltaCash)-(deltaCl-deltaStd-deltaTax)-depreciation, measure=accrualAmount/avgAssets;
  return {state:"calculated",method:"sloan-1996-balance-sheet-accrual",delta_current_assets:deltaCa,delta_cash:deltaCash,delta_current_liabilities:deltaCl,delta_short_term_debt:deltaStd,delta_taxes_payable:deltaTax,depreciation_and_amortization:depreciation,accrual_amount:accrualAmount,accrual_measure:measure,absolute_accrual_measure:Math.abs(measure),interpretation:measure<0?"income-decreasing-accrual":measure>0?"income-increasing-accrual":"zero-net-accrual"};
}

function ohlson(data: RecordValue): RecordValue {
  const assets=positive(data,"total_assets"), priceIndex=positive(data,"price_level_index"), liabilities=positive(data,"total_liabilities");
  const currentAssets=positive(data,"current_assets"), currentLiabilities=nonnegative(data,"current_liabilities");
  const netIncome=numberValue(data,"net_income"), priorIncome=numberValue(data,"prior_net_income"), chinDenominator=Math.abs(netIncome)+Math.abs(priorIncome);
  if (chinDenominator===0) throw new RangeError("current and prior net income cannot both be zero");
  const variables={size:Math.log(assets/priceIndex),tlta:liabilities/assets,wcta:numberValue(data,"working_capital")/assets,clca:currentLiabilities/currentAssets,oeneg:+(liabilities>assets),nita:netIncome/assets,futl:numberValue(data,"funds_from_operations")/liabilities,intwo:+(netIncome<0&&priorIncome<0),chin:(netIncome-priorIncome)/chinDenominator};
  const score=-1.32-.407*variables.size+6.03*variables.tlta-1.43*variables.wcta+.0757*variables.clca-1.72*variables.oeneg-2.37*variables.nita-1.83*variables.futl+.285*variables.intwo-.521*variables.chin;
  const probability=logistic(score);
  return {state:"calculated",method:"ohlson-1980-model-1",variables,o_score:score,logistic_probability:probability,screen:probability>.038?"above-original-cutoff":"below-original-cutoff",cutoff_probability:.038};
}

function zmijewski(data: RecordValue): RecordValue {
  const assets=positive(data,"total_assets"), liabilities=nonnegative(data,"total_liabilities"), currentLiabilities=positive(data,"current_liabilities");
  const variables={roa:numberValue(data,"net_income")/assets,leverage:liabilities/assets,current_ratio:numberValue(data,"current_assets")/currentLiabilities};
  const score=-4.336-4.513*variables.roa+5.679*variables.leverage+.004*variables.current_ratio, probability=normalCdf(score);
  return {state:"calculated",method:"zmijewski-1984-probit",variables,x_score:score,probit_probability:probability,screen:score>0?"distress-side":"non-distress-side",index_cutoff:0};
}

function springate(data: RecordValue): RecordValue {
  const assets=positive(data,"total_assets"), currentLiabilities=positive(data,"current_liabilities");
  const ratios={working_capital_to_assets:numberValue(data,"working_capital")/assets,ebit_to_assets:numberValue(data,"ebit")/assets,ebt_to_current_liabilities:numberValue(data,"ebt")/currentLiabilities,sales_to_assets:numberValue(data,"sales")/assets};
  const score=1.03*ratios.working_capital_to_assets+3.07*ratios.ebit_to_assets+.66*ratios.ebt_to_current_liabilities+.4*ratios.sales_to_assets;
  return {state:"calculated",method:"springate-1978-four-ratio",ratios,s_score:score,screen:score<.862?"distress-side":"non-distress-side",cutoff:.862};
}

function taffler(data: RecordValue): RecordValue {
  const currentLiabilities=positive(data,"current_liabilities"), liabilities=positive(data,"total_liabilities"), assets=positive(data,"total_assets"), dailyExpenses=positive(data,"daily_operating_expenses");
  const ratios={pbt_to_current_liabilities:numberValue(data,"profit_before_tax")/currentLiabilities,current_assets_to_total_liabilities:numberValue(data,"current_assets")/liabilities,current_liabilities_to_total_assets:currentLiabilities/assets,no_credit_interval_days:(numberValue(data,"quick_assets")-currentLiabilities)/dailyExpenses};
  const score=3.2+12.18*ratios.pbt_to_current_liabilities+2.5*ratios.current_assets_to_total_liabilities-10.68*ratios.current_liabilities_to_total_assets+.0289*ratios.no_credit_interval_days;
  return {state:"calculated",method:"taffler-1983-uk-industrial-transformed",ratios,z_score:score,screen:score<0?"distress-side":"non-distress-side",index_cutoff:0};
}

function fulmer(data: RecordValue): RecordValue {
  const assets=positive(data,"total_assets"), debt=positive(data,"total_debt"), equity=positive(data,"equity"), interest=positive(data,"interest_expense"), tangible=positive(data,"tangible_assets_usd_thousands"), ebit=numberValue(data,"ebit");
  if (ebit/interest<=0) throw new RangeError("EBIT/interest must be positive for the logarithm");
  const variables={retained_earnings_to_assets:numberValue(data,"retained_earnings")/assets,sales_to_assets:numberValue(data,"sales")/assets,ebt_to_equity:numberValue(data,"ebt")/equity,operating_cash_flow_to_debt:numberValue(data,"operating_cash_flow")/debt,debt_to_assets:debt/assets,current_liabilities_to_assets:numberValue(data,"current_liabilities")/assets,log10_tangible_assets_usd_thousands:Math.log10(tangible),working_capital_to_debt:numberValue(data,"working_capital")/debt,log10_ebit_interest:Math.log10(ebit/interest)};
  const score=5.528*variables.retained_earnings_to_assets+.212*variables.sales_to_assets+.073*variables.ebt_to_equity+1.270*variables.operating_cash_flow_to_debt-.120*variables.debt_to_assets+2.335*variables.current_liabilities_to_assets+.575*variables.log10_tangible_assets_usd_thousands+1.083*variables.working_capital_to_debt+.894*variables.log10_ebit_interest-6.075;
  return {state:"calculated",method:"fulmer-1984-small-firm-nine-factor",variables,h_score:score,screen:score<0?"distress-side":"non-distress-side",index_cutoff:0,scale_policy:"tangible assets expressed in USD thousands before log10"};
}

function grover(data: RecordValue): RecordValue {
  const assets=positive(data,"total_assets");
  const variables={working_capital_to_assets:numberValue(data,"working_capital")/assets,ebit_to_assets:numberValue(data,"ebit")/assets,roa:numberValue(data,"net_income")/assets};
  const score=1.650*variables.working_capital_to_assets+3.404*variables.ebit_to_assets-.016*variables.roa+.057;
  const zone=score<=-.02?"distress-zone":score>=.01?"non-distress-zone":"grey-zone";
  return {state:"calculated",method:"grover-2001-reported-reestimation",variables,g_score:score,zone,threshold_policy:"distress<=-0.02; grey=(-0.02,0.01); non-distress>=0.01"};
}

function noa(row: RecordValue): number {
  return numberValue(row,"total_assets")-numberValue(row,"cash")-numberValue(row,"investments_and_advances")+numberValue(row,"investments_at_equity")-numberValue(row,"total_liabilities")-numberValue(row,"preferred_stock");
}

function dechowF(data: RecordValue): RecordValue {
  const current=objectValue(data,"current"), prior=objectValue(data,"prior"), prior2=objectValue(data,"prior2");
  const avgAssets=(positive(current,"total_assets")+positive(prior,"total_assets"))/2;
  const priorAvgAssets=(positive(prior,"total_assets")+positive(prior2,"total_assets"))/2;
  const currentCashSales=numberValue(current,"sales")-(numberValue(current,"receivables")-numberValue(prior,"receivables"));
  const priorCashSales=numberValue(prior,"sales")-(numberValue(prior,"receivables")-numberValue(prior2,"receivables"));
  if (priorCashSales===0) throw new RangeError("prior cash sales must be nonzero");
  const variables={
    rsst_accruals:(noa(current)-noa(prior))/avgAssets,
    change_receivables:(numberValue(current,"receivables")-numberValue(prior,"receivables"))/avgAssets,
    change_inventory:(numberValue(current,"inventory")-numberValue(prior,"inventory"))/avgAssets,
    soft_assets:(numberValue(current,"total_assets")-numberValue(current,"net_ppe")-numberValue(current,"cash"))/numberValue(current,"total_assets"),
    change_cash_sales:currentCashSales/priorCashSales-1,
    change_roa:numberValue(current,"net_income")/avgAssets-numberValue(prior,"net_income")/priorAvgAssets,
    actual_issuance:+booleanValue(data,"issued_equity_or_long_term_debt"),
  };
  const logit=-7.893+.790*variables.rsst_accruals+2.518*variables.change_receivables+1.191*variables.change_inventory+1.979*variables.soft_assets+.171*variables.change_cash_sales-.932*variables.change_roa+1.029*variables.actual_issuance;
  const probability=logistic(logit), score=probability/.0037;
  const band=score<=1?"at-or-below-baseline":score<1.85?"above-baseline":score<2.45?"substantial":"high-screen";
  return {state:"calculated",method:"dechow-et-al-2011-model-1",variables,logit,misstatement_probability:probability,f_score:score,band,unconditional_probability:.0037};
}

function solve(matrix: number[][], vector: number[]): number[] {
  const n=vector.length, augmented=matrix.map((row,index)=>[...row,vector[index]]);
  for(let col=0;col<n;col++){
    let pivot=col;
    for(let row=col+1;row<n;row++) if(Math.abs(augmented[row][col])>Math.abs(augmented[pivot][col])) pivot=row;
    if(Math.abs(augmented[pivot][col])<1e-12) throw new RangeError("regression design matrix is singular");
    [augmented[col],augmented[pivot]]=[augmented[pivot],augmented[col]];
    const scale=augmented[col][col]; augmented[col]=augmented[col].map(value=>value/scale);
    for(let row=0;row<n;row++) if(row!==col){
      const factor=augmented[row][col];
      augmented[row]=augmented[row].map((left,index)=>left-factor*augmented[col][index]);
    }
  }
  return augmented.map(row=>row[row.length-1]);
}

function ols(x: number[][], y: number[]): [number[],number[]] {
  if(!x.length||x.length!==y.length) throw new RangeError("regression requires aligned observations");
  const width=x[0].length;
  if(x.length<=width||x.some(row=>row.length!==width)) throw new RangeError("regression requires more aligned observations than predictors");
  const xtx=Array.from({length:width},(_,i)=>Array.from({length:width},(_,j)=>x.reduce((total,row)=>total+row[i]*row[j],0)));
  const xty=Array.from({length:width},(_,i)=>x.reduce((total,row,index)=>total+row[i]*y[index],0));
  const beta=solve(xtx,xty);
  const residuals=y.map((target,index)=>target-beta.reduce((total,coefficient,j)=>total+coefficient*x[index][j],0));
  return [beta,residuals];
}

function dechowDichev(data: RecordValue): RecordValue {
  const raw=data.observations;
  if(!Array.isArray(raw)||raw.length<7||raw.some(row=>!row||typeof row!=="object"||Array.isArray(row))) throw new RangeError("observations must contain at least seven period records");
  const rows=raw as RecordValue[], cfo=rows.map(row=>numberValue(row,"cfo_scaled")), accruals=rows.map(row=>numberValue(row,"working_capital_accrual_scaled")), periods=rows.map(row=>String(row.period??""));
  if(periods.some(period=>!period)||new Set(periods).size!==periods.length) throw new RangeError("period labels must be unique and nonempty");
  const x=rows.slice(1,-1).map((_,offset)=>{const index=offset+1;return [1,cfo[index-1],cfo[index],cfo[index+1]];});
  const y=accruals.slice(1,-1), [beta,residuals]=ols(x,y), df=residuals.length-beta.length;
  const residualStd=Math.sqrt(residuals.reduce((total,value)=>total+value*value,0)/df), fitted=y.map((target,index)=>target-residuals[index]);
  return {state:"calculated",method:"dechow-dichev-2002-firm-specific",coefficients:{intercept:beta[0],cfo_t_minus_1:beta[1],cfo_t:beta[2],cfo_t_plus_1:beta[3]},estimation_periods:periods.slice(1,-1),fitted_accruals:fitted,residuals,accrual_quality:residualStd,interpretation:"higher residual dispersion means lower accrual quality",available_after_period:periods[periods.length-1]};
}

function modifiedJones(data: RecordValue): RecordValue {
  const raw=data.industry_year_sample, targetId=data.target_id;
  if(!Array.isArray(raw)||raw.length<5||raw.some(row=>!row||typeof row!=="object"||Array.isArray(row))) throw new RangeError("industry_year_sample must contain at least five records");
  if(typeof targetId!=="string"||!targetId) throw new TypeError("target_id must be a nonempty string");
  const rows=raw as RecordValue[], ids=rows.map(row=>row.entity_id);
  if(new Set(ids).size!==ids.length||!ids.includes(targetId)) throw new RangeError("entity IDs must be unique and include target_id");
  const design=(row:RecordValue):number[]=>{const priorAssets=positive(row,"prior_total_assets");return [1/priorAssets,(numberValue(row,"revenue_change")-numberValue(row,"receivables_change"))/priorAssets,numberValue(row,"net_ppe")/priorAssets];};
  const peers=rows.filter(row=>row.entity_id!==targetId), x=peers.map(design), y=peers.map(row=>numberValue(row,"total_accruals")/positive(row,"prior_total_assets"));
  const [beta,residuals]=ols(x,y), target=rows.find(row=>row.entity_id===targetId) as RecordValue, targetX=design(target);
  const scaledTotal=numberValue(target,"total_accruals")/positive(target,"prior_total_assets"), nondiscretionary=beta.reduce((total,coefficient,index)=>total+coefficient*targetX[index],0), discretionary=scaledTotal-nondiscretionary;
  return {state:"calculated",method:"modified-jones-1995-peer-estimation",target_id:targetId,estimation_count:peers.length,coefficients:{inverse_assets:beta[0],revenue_less_receivables:beta[1],net_ppe:beta[2]},peer_residuals:residuals,scaled_total_accruals:scaledTotal,nondiscretionary_accruals:nondiscretionary,discretionary_accruals:discretionary,absolute_discretionary_accruals:Math.abs(discretionary),interpretation:"signed residual; no universal manipulation cutoff"};
}

const calculators: Record<string,(data:RecordValue)=>RecordValue> = {
  "D18-F04-A01":altman,"D18-F04-A02":piotroski,"D18-F04-A03":beneish,"D18-F04-A04":sloan,
  "D18-F04-A05":ohlson,"D18-F04-A06":zmijewski,"D18-F04-A07":springate,"D18-F04-A08":taffler,
  "D18-F04-A09":fulmer,"D18-F04-A10":grover,"D18-F04-A11":dechowF,"D18-F04-A12":dechowDichev,"D18-F04-A13":modifiedJones,
};

export function calculate(topicId: string, data: RecordValue): RecordValue {
  if(!data||typeof data!=="object"||Array.isArray(data)) throw new TypeError("data must be an object");
  const calculator=calculators[topicId];
  if(!calculator) throw new RangeError(`unsupported topic_id: ${topicId}`);
  return calculator(data);
}

// --- per-topic entry points
//
// One narrow export per topic. Each binds a single id and delegates to the
// dispatcher above, which still holds the arithmetic — so these change no
// behaviour and exist because a published subpath must be its own function
// rather than a shared `calculate(topicId, …)`.

/** Altman Z-Score — D18-F04-A01. */
export function altmanZScore(data: RecordValue): RecordValue {
  return calculate("D18-F04-A01", data);
}

/** Piotroski F-Score — D18-F04-A02. */
export function piotroskiFScore(data: RecordValue): RecordValue {
  return calculate("D18-F04-A02", data);
}

/** Beneish M-Score — D18-F04-A03. */
export function beneishMScore(data: RecordValue): RecordValue {
  return calculate("D18-F04-A03", data);
}

/** Sloan Accrual Measure — D18-F04-A04. */
export function sloanAccrualMeasure(data: RecordValue): RecordValue {
  return calculate("D18-F04-A04", data);
}

/** Ohlson O-Score — D18-F04-A05. */
export function ohlsonOScore(data: RecordValue): RecordValue {
  return calculate("D18-F04-A05", data);
}

/** Zmijewski X-Score — D18-F04-A06. */
export function zmijewskiXScore(data: RecordValue): RecordValue {
  return calculate("D18-F04-A06", data);
}

/** Springate S-Score — D18-F04-A07. */
export function springateSScore(data: RecordValue): RecordValue {
  return calculate("D18-F04-A07", data);
}

/** Taffler Z-Score — D18-F04-A08. */
export function tafflerZScore(data: RecordValue): RecordValue {
  return calculate("D18-F04-A08", data);
}

/** Fulmer H-Score — D18-F04-A09. */
export function fulmerHScore(data: RecordValue): RecordValue {
  return calculate("D18-F04-A09", data);
}

/** Grover G-Score — D18-F04-A10. */
export function groverGScore(data: RecordValue): RecordValue {
  return calculate("D18-F04-A10", data);
}

/** Dechow F-Score for Misstatement Risk — D18-F04-A11. */
export function dechowFScoreForMisstatementRisk(data: RecordValue): RecordValue {
  return calculate("D18-F04-A11", data);
}

/** Dechow-Dichev Accrual Quality — D18-F04-A12. */
export function dechowDichevAccrualQuality(data: RecordValue): RecordValue {
  return calculate("D18-F04-A12", data);
}

/** Modified Jones Discretionary Accrual Model — D18-F04-A13. */
export function modifiedJonesDiscretionaryAccrualModel(data: RecordValue): RecordValue {
  return calculate("D18-F04-A13", data);
}
The embedded lab now expands to its full document height, keeping the article as the only scroll surface.