
 By Islam Baraka
Normalize a dense multi-period statement while preserving signs, row mappings, point-in-time versus period bases, and percentage-point changes.
The decision this tutorial makes visible
Absolute company size can obscure changes in cost structure, asset mix, funding, and margins; common-sizing makes composition directly visible.
The precise question is: What percentage of the selected statement base does each signed line item represent, and how did that mix change?
An analyst needs to see what changed in the business; a builder needs every source fact, clock, unit, sign, average, adjustment, and reason code needed to reproduce the diagnostic.
Intuition before notation
Every period becomes a 100-unit statement. Percentage-point movement describes composition change, not growth and not causation.
This package selects one explicit statement-ratio convention and compares material alternatives. It does not label issuer-defined measures as universal or hide non-meaningful denominator states.
Scope and nearby methods
Income-statement rows divide by period revenue; balance-sheet rows divide by same-date total assets. The package preserves reported signs and requires identical mapped rows across periods.
| Variant | Definition | Best use | Main limitation |
|---|---|---|---|
| Income statement | Signed rows / revenue | Margin and cost-structure analysis | Expense presentation signs differ |
| Balance sheet | Rows / total assets | Asset and financing composition | Assets and liabilities can both be shown as positive in presentation |
| Cash-flow common size | Cash-flow rows / revenue or another declared base | Cash conversion analysis | No universal base |
What is sourced, selected, synthetic, and derived
| Role | Material claim | Evidence | Boundary |
|---|---|---|---|
| Sourced fact | Balance sheets describe a point in time, while income and cash-flow statements describe a period; notes are part of interpreting the reported amounts. | S1 and supporting sources | It does not prescribe the package ratios, XBRL mapping, normalization choices, or cross-company conclusions. |
| Implementation choice | Income-statement rows divide by period revenue; balance-sheet rows divide by same-date total assets. The package preserves reported signs and requires identical mapped rows across periods. | Frozen package definition contract | Nearby variants remain named and separate. |
| Synthetic teaching input | All company amounts, periods, scenarios, and calculated teaching paths are repository-authored synthetic data. | datasets/canonical-input.json and scenario-results.json | No value is represented as a live provider observation or filed issuer fact. |
| Author-derived calculation | The synthetic four-year income statement contains 12 rows per year (48 observations). FY2026 net income is 141/1,600 = 8.8125% of revenue, up 0.6746 percentage points from FY2025's 118/1,450 = 8.1379%. | Formula, shared fixture, independent arithmetic, and Python/TypeScript parity | Arithmetic fidelity does not prove an analytical or investment conclusion. |
| Scope boundary | The output does not establish investment quality, solvency, valuation, peer superiority, forecast accuracy, profitability, covenant compliance, or investment advice. | No empirical or advisory claim is tested | Use the result as one documented diagnostic. |
Primary regulator, accounting-body, institution, paper, and filed-entity sources establish reporting and definition boundaries. The fixtures, calculations, scenarios, and conclusions about those fixtures are repository-authored and synthetic.
Formula, symbols, and numerical policy
Common Size(row, period) = Signed Line Item(row, period) / Declared Base(period) × 100%
| Symbol | Meaning | Unit | Policy |
|---|---|---|---|
| xᵢₜ | Signed line item i in period t | currency | Filed/mapped sign retained |
| Bₜ | Declared same-period base | currency | Revenue or total assets |
| CSᵢₜ | Common-size percentage | percent | 100×xᵢₜ/Bₜ |
| Δpp | Percentage-point change | points | Difference of percentages, not percent growth |
- Use one currency and scale for every amount in a calculation; ratios are dimensionless and days use the declared period day count.
- Do not round inputs or intermediate averages; round displayed percentages, days, and multiples only after calculation.
- Return a diagnostic null for structurally valid but economically uninterpretable denominators; reject malformed schemas and non-finite numbers.
- Preserve filed signs in common-size statements and normalize expense/debt signs explicitly for ratios that require positive denominators.
Read the formula in the same order as the algorithm. Validate identity, ordering, units, and supported state first. Apply the selected denominator, equality, and mapping rules second. Calculate with unrounded numeric values. Round only at the declared presentation boundary, and preserve null as a diagnostic rather than coercing it to zero.
Build the algorithm
- Map one stable ordered row set across periods.
- Select revenue or total assets as the declared base.
- Divide each signed row by its same-period base and multiply by 100.
- Compare like rows in percentage points and retain raw values.
Production-minded operational checklist
- Freeze framework and statement type
- Version row mapping
- Preserve signs and raw facts
- Explain percentage-point changes
A precise ratio is unsafe when its framework, period, unit, source fact, numerator, denominator, average, sign, or adjustment policy is ambiguous. Stop and map the evidence before calculating.
Worked synthetic example
The canonical fixture is synthetic teaching data, not a filed issuer statement or provider observation. Its primary author-derived output,
focus_percentage, is 8.8125. The complete input and output
are in datasets/canonical-input.json and datasets/expected-output.json.
The synthetic four-year income statement contains 12 rows per year (48 observations). FY2026 net income is 141/1,600 = 8.8125% of revenue, up 0.6746 percentage points from FY2025's 118/1,450 = 8.1379%.
Counterfactual checkpoint
Scale-only growth. Multiply every row and the base by the same factor. The output changes because Common-sizing measures composition, not absolute size.
The structured result retains state and diagnostics in addition to the primary number. That makes the calculation independently reviewable and prevents a partial, null, rejected, or definition-bounded outcome from being mistaken for an unqualified value.
Boundary and counterexample workbook
The playground computes every scenario at 61 deterministic parameter states.
The table uses the declared focus step and states whether that focus reproduces
the canonical fixture. The full state ledger and compressed transition
segments are in datasets/scenario-results.json.
| Scenario | Review focus | Purpose | State | Primary output | Diagnostic | Decision segments |
|---|---|---|---|---|---|---|
| Canonical net-margin sweep | Step 30 · canonical fixture | Move the latest net-income row through the canonical percentage. | calculated | 8.81% of Revenue | calculated · signed-line-items-divided-by-period-base | 1 |
| Gross-margin pressure | Step 30 · comparison focus | Change COGS while revenue stays fixed. | calculated | 8.81% of Revenue | calculated · signed-line-items-divided-by-period-base | 1 |
| R&D composition | Step 30 · comparison focus | Change R&D intensity across the latest period. | calculated | 8.81% of Revenue | calculated · signed-line-items-divided-by-period-base | 1 |
| Scale-only growth | Step 30 · canonical fixture | Scale all latest rows and preserve percentages. | calculated | 8.81% of Revenue | calculated · signed-line-items-divided-by-period-base | 1 |
| Operating-margin focus | Step 30 · comparison focus | Switch the focus row to operating profit. | calculated | 14.00% of Revenue | calculated · signed-line-items-divided-by-period-base | 1 |
| Cash-flow focus | Step 30 · comparison focus | Switch the focus row to operating cash flow. | calculated | 13.62% of Revenue | calculated · signed-line-items-divided-by-period-base | 1 |
| Earlier-period comparison | Step 30 · comparison focus | Change the prior net-income mix and the latest percentage-point bridge. | calculated | 8.81% of Revenue | calculated · signed-line-items-divided-by-period-base | 1 |
These rows are not backtest observations. They are controlled counterexamples that expose how one driver changes the state, output, or reason code while the rest of the contract stays fixed.
Visualize the boundary

Open this SVG at full size, or use the guided playground to compare the seven topic-specific canonical, boundary, policy, and failure scenarios.
The Mermaid flow answers where the selected calculation sits in the processing sequence. The SVG keeps the formula, output, decision boundary, and invariant visible together. The lab lets the reader step through the same structured states without changing the underlying definition.
Five coordinated teaching views
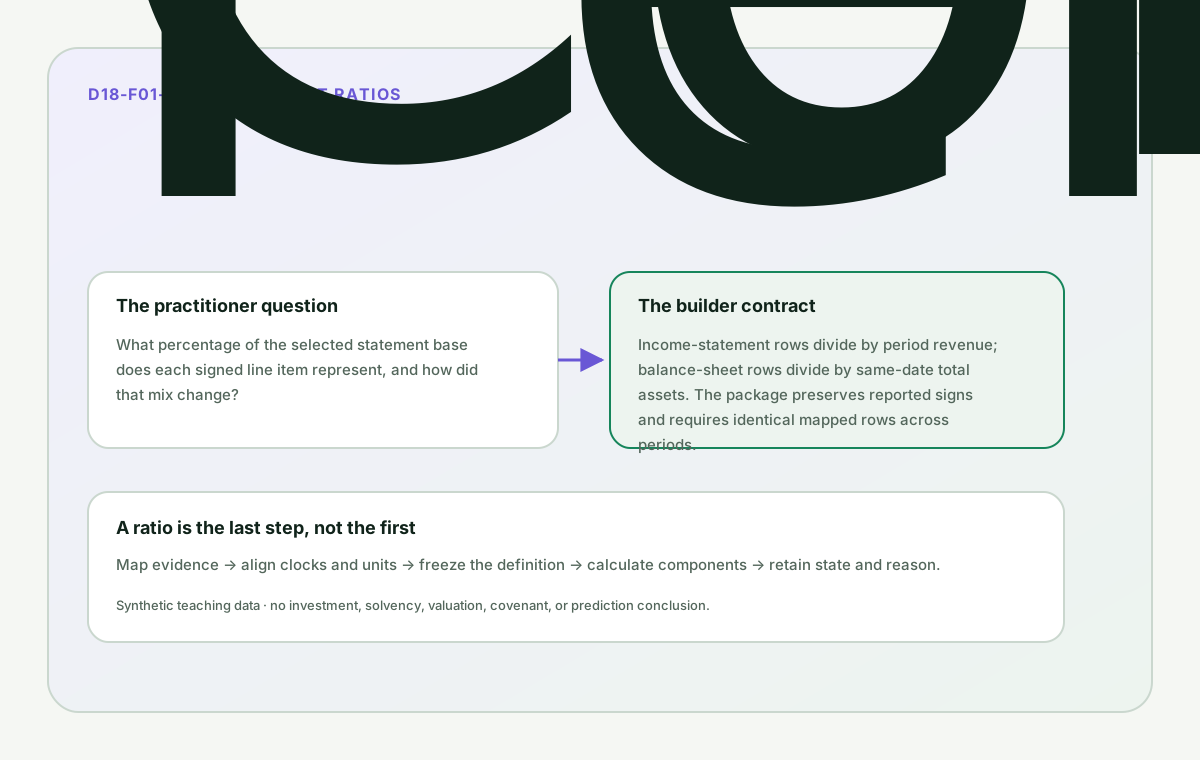
The hero fixes the practitioner question and the builder contract before any ratio is interpreted.
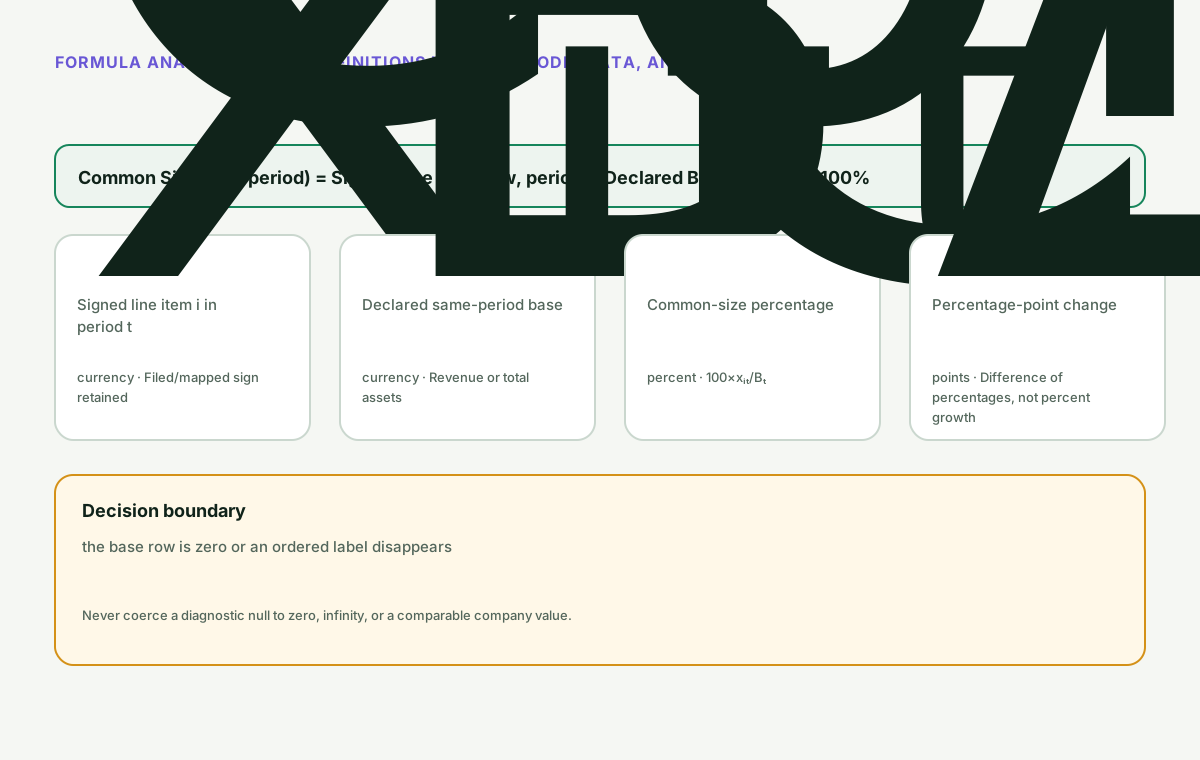
The formula view keeps units, policies, and the material denominator boundary beside the symbols.
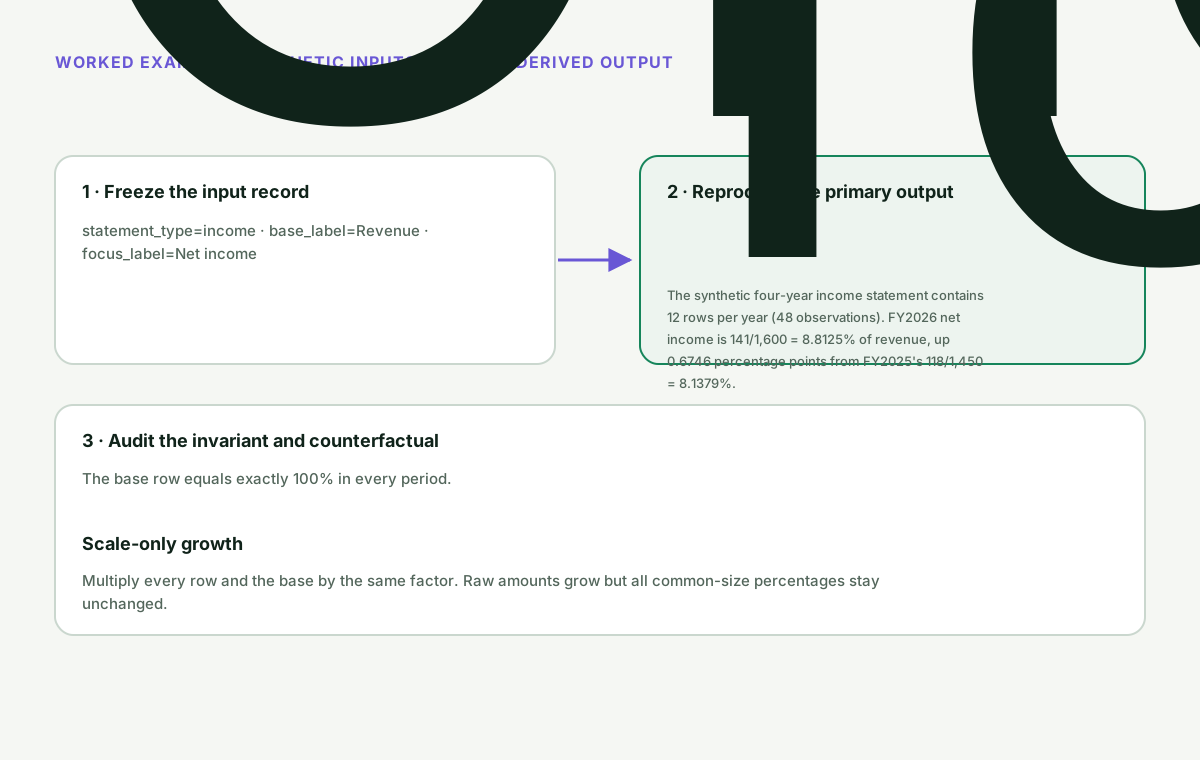
The worked-example view separates synthetic input, author-derived output, invariant, and counterfactual.
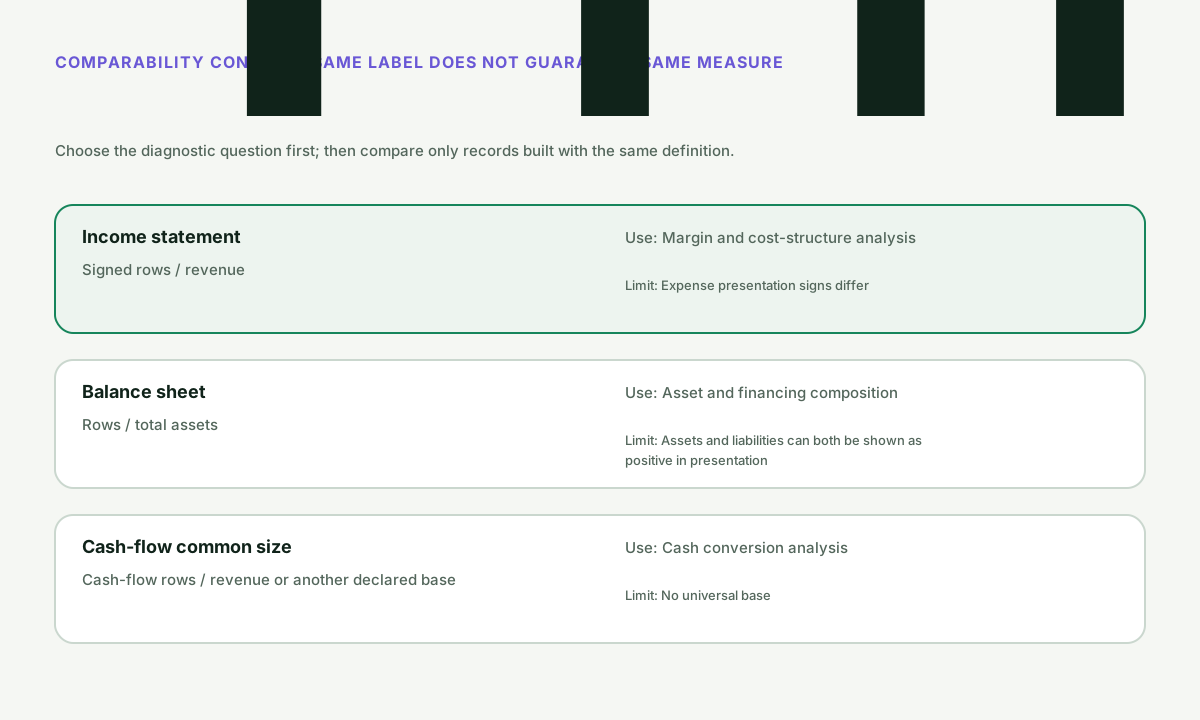
The comparison view prevents same-label measures from being treated as interchangeable.
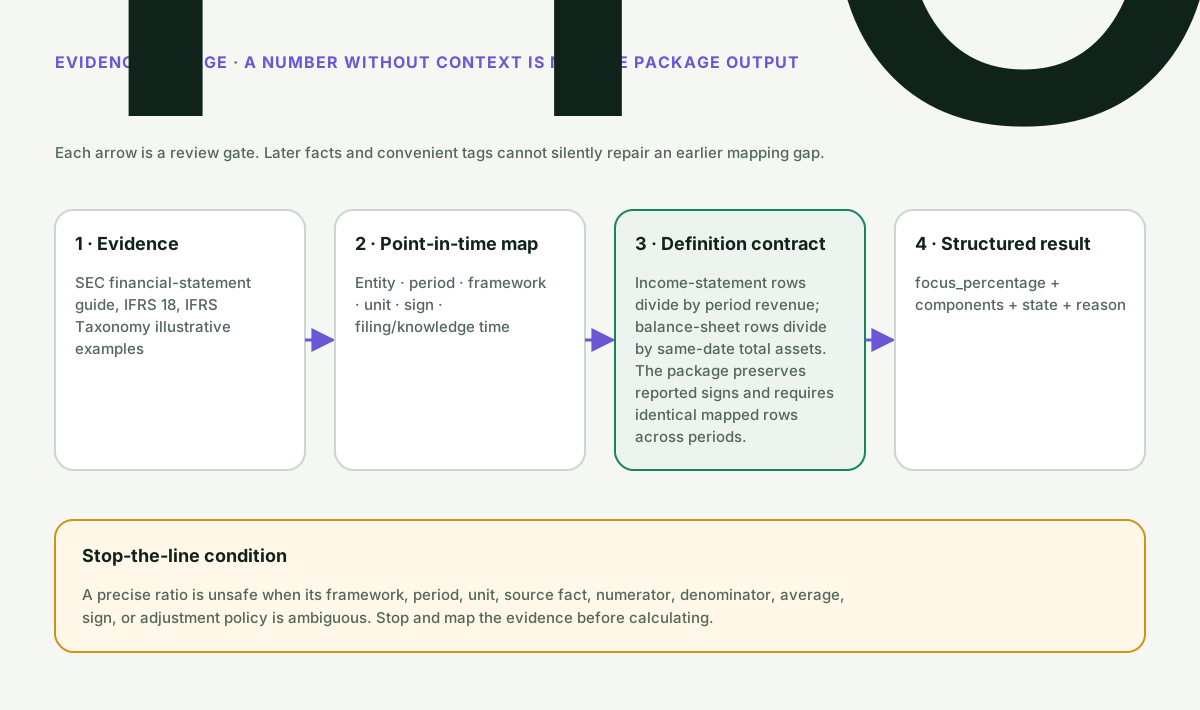
The lineage view shows where entity, period, framework, unit, sign, and definition decisions enter.
| Asset | Learning purpose | Static fallback |
|---|---|---|
| Article hero | Question and learning contract | Embedded SVG text |
| Formula anatomy | Units, policies, denominator gate | Symbol table |
| Worked example | Independent arithmetic and invariant | Fixture JSON |
| Definition comparison | Variant selection | Comparison table |
| Evidence lineage | Source-to-output audit path | Claim ledger |
| Guided playground | Canonical, boundary, comparison, and failure states | Scenario ledger |
Implementation walkthrough
The Python and TypeScript references validate the same JSON contract, retain components and reason codes, calculate at full precision, and are compared against shared expected output plus 427 scenario states.
The main implementation branches are:
- row mapping/order differs — Reject, because Percentage comparisons would silently compare unlike concepts.
- base is zero — Reject, because Percentages are undefined.
- focus percentage changes — Report percentage points, because Composition change is not raw growth.
Neither reference silently fetches data, mutates caller-owned inputs outside the declared engine behavior, guesses hidden state, or substitutes a provider default. Shared JSON fixtures make value, null, state, and reason-code drift visible across languages.
Testing and validation
Definition tests compare every canonical field, reject malformed state, and exercise the material boundary. Family validation recomputes every playground state from the reference function. Independent arithmetic is recorded beside the fixture rather than inferred only from implementation output.
The audit must preserve these invariants:
- The base row equals exactly 100% in every period.
- Every period uses the same ordered mapped labels.
- Scaling every amount in a period by the same positive factor leaves its common-size percentages unchanged.
- The output retains components, state, and a reason code rather than publishing an unexplained scalar.
Passing definition and parity checks proves that the implementation matches the selected contract. It does not prove production performance, universal applicability, or a later market outcome.
Failure modes and misuse
- A correct ratio can still be distorted by acquisitions, disposals, seasonality, inflation, foreign exchange, restatements, or classification choices.
- Cross-company comparison requires the same framework, consolidation scope, period length, mapping, and analytical definition.
- Ratios summarize reported accounting amounts; they do not measure market value, forecast cash flows, or establish investment merit.
Debugging order
When a result looks surprising, inspect the state in this order:
- Confirm entity, period, framework, currency, and scale
- Trace every source fact and sign
- Recompute averages and bridges independently
- Check denominator state and selected variant
- Compare unrounded Python and TypeScript output
Evidence and historical boundary
Historical decision: not useful. A named issuer is not useful for the canonical arithmetic because filings mix company-specific labels, fiscal calendars, tax effects, lease policies, segments, and non-GAAP reconciliations. Primary filings are used to prove definition variability; controlled synthetic statements isolate the mechanism without implying a company judgment.
The primary sources are SEC financial-statement guide, IFRS 18, IFRS Taxonomy illustrative examples, SEC EDGAR XBRL APIs. They support the source roles listed in the research ledger. They do not supply a redistributable filed/provider observation or support investment quality, solvency, valuation, peer superiority, forecast accuracy, profitability, covenant compliance, or investment advice.
Practical questions and review answers
What exactly does this package calculate?
Income-statement rows divide by period revenue; balance-sheet rows divide by same-date total assets. The package preserves reported signs and requires identical mapped rows across periods. The structured output includes components, state, and a reason code; the headline ratio is never the whole audit record.
Why can a filing platform, data vendor, spreadsheet, or company presentation disagree?
They may map different statement rows, fiscal periods, signs, tax or lease policies, cash definitions, balance averages, or non-GAAP adjustments. Compare the definition and evidence ledger before comparing numbers.
Can quarterly, trailing-twelve-month, and annual facts be mixed?
No. A flow numerator and every flow denominator must cover the declared period, while balance-sheet stocks must come from the matching boundary dates. Annualization is a separate, declared analytical transformation.
When should the output be null rather than zero or infinity?
At the material boundary: the base row is zero or an ordered label disappears. Null means the package cannot answer its stated question under that denominator state; it is not a missing cosmetic value.
Does a negative, high, or improving result automatically mean good or bad?
No. Interpretation depends on sector, business model, accounting framework, period, definition, and the components that moved. The ratio can describe a state without establishing its cause or desirability.
Does passing the code and parity checks prove investment value?
No. It proves that Python, TypeScript, fixtures, visuals, and the playground implement the frozen definition. It does not establish forecasting ability, solvency, covenant compliance, valuation, peer superiority, or investment suitability.
Where can I inspect every scenario rather than one example?
Open the guided 427-state playground and the full scenario-results.json.
Decision-lab protocol
Use the four-stage decision lab as an exercise, not as a chart to watch:
- Orient: select one scenario and state what is held fixed, the selected definition, and the invalid/unsupported boundary.
- Predict: before revealing the challenge, choose whether
focus_percentageshould increase, decrease, stay unchanged, or change diagnostic state. Start with: Multiply every row and the base by the same factor. - Experiment: use the topic-specific driver slider and curated stops; inspect the causal components and reason code rather than only the headline result.
- Explain: compare the canonical anchor with the candidate and complete this sentence: “The output changed because ___ moved, while ___ remained fixed; this does not establish ___.”
The visible lesson uses curated states. The complete 427-state evidence ledger remains available for reproducibility and boundary review.
Compact glossary
- xᵢₜ: Signed line item i in period t
- Bₜ: Declared same-period base
- CSᵢₜ: Common-size percentage
- Diagnostic state: The structured interpretation status retained beside the numerical result.
- Definition contract: The frozen numerator, denominator, period, sign, mapping, and invalid-state policy used by this package.
Continue the system
- Prerequisite: Start here; no earlier topic is required beyond aligned financial statements.
- Closest comparison: D18-F01-A01, D18-F01-A03
- Next topic: D18-F01-A01
Summary and next topic
You can now carry the result from Common-Size Statements into Free-Cash-Flow DCF only after carrying forward the fact-mapping ledger and resetting method-specific numerator and denominator choices. The learning flow is: Net-Debt/EBITDA → Common-Size Statements → Free-Cash-Flow DCF. Carry the result forward only with its scope, clock, state, and evidence label.
Rendered from the canonical Mermaid sources linked by this article.
Common-Size Statements calculation flow
This flow identifies the selected calculation stages and the structured output.
Takeaway: Common-sizing removes scale but not accounting choices: stable row mappings and signed values are still required before a percentage means anything.
ReferencesPrimary sources and evidence notesExpand the source trail, evidence role, and limitations behind the engineering choices.
Expand the source trail, evidence role, and limitations behind the engineering choices.
S1 — Beginners' Guide to Financial Statements
- Organization or authors: U.S. Securities and Exchange Commission
- Source type: Official regulator investor publication
- Publication or effective date: 2007-02-05
- Version: Current SEC web publication
- URL or DOI: https://www.sec.gov/about/reports-publications/investor-publications/beginners-guide-financial-statements
- Accessed: 2026-08-04
- Jurisdiction: United States public-company reporting
- Supports: Balance sheets describe a point in time, while income and cash-flow statements describe a period; notes are part of interpreting the reported amounts.
- Limitations: It does not prescribe the package ratios, XBRL mapping, normalization choices, or cross-company conclusions.
S2 — IFRS 18 Presentation and Disclosure in Financial Statements
- Organization or authors: International Accounting Standards Board
- Source type: Official accounting-standard overview
- Publication or effective date: 2024-04
- Version: Effective for annual periods beginning on or after 2027-01-01; early application permitted
- URL or DOI: https://www.ifrs.org/issued-standards/list-of-standards/ifrs-18-presentation-and-disclosure-in-financial-statements/
- Accessed: 2026-08-04
- Jurisdiction: IFRS reporting
- Supports: IFRS 18 replaces IAS 1, defines new profit-or-loss subtotals, addresses aggregation and disaggregation, and is effective in 2027 unless early applied.
- Limitations: The ratios remain analytical constructions; framework transition dates and issuer adoption must be checked for each record.
S3 — IFRS Accounting Taxonomy Illustrative Examples
- Organization or authors: IFRS Foundation
- Source type: Official taxonomy implementation examples
- Publication or effective date: current
- Version: Accessed 2026-08-04
- URL or DOI: https://www.ifrs.org/issued-standards/ifrs-taxonomy/ifrs-taxonomy-illustrative-examples/
- Accessed: 2026-08-04
- Jurisdiction: IFRS digital reporting
- Supports: Taxonomy examples show that statement presentation and tagging retain reporting context rather than collapsing every issuer into one fixed row schema.
- Limitations: Illustrative tags do not make common-size analysis or cross-issuer mappings automatic.
S4 — EDGAR Application Programming Interfaces
- Organization or authors: U.S. Securities and Exchange Commission
- Source type: Official regulator technical documentation
- Publication or effective date: 2025-04-08
- Version: Company Facts, Company Concept, and Frames API documentation
- URL or DOI: https://www.sec.gov/search-filings/edgar-application-programming-interfaces
- Accessed: 2026-08-04
- Jurisdiction: United States public filings
- Supports: EDGAR exposes filed XBRL facts with taxonomy, unit, form, period, and filing context; company extensions and fiscal-calendar differences require explicit mapping.
- Limitations: A matching tag does not by itself prove semantic comparability, adjustment policy, or the correct ratio denominator.
Evidence boundary
The sources establish the exact rule, interface, protocol, or research context named above. They do not verify the repository-authored synthetic fixture, thresholds, empirical usefulness, execution probability, or profitability. Package-selected choices remain labeled as implementation choices wherever they are used.
Full dependency-light reference implementations in both supported languages.
/** Deterministic TypeScript reference calculations for D18-F01. */

type Inputs = Record<string, unknown>;
type Output = Record<string, unknown>;

function numberValue(name: string, value: unknown): number {
  if (typeof value !== "number" || !Number.isFinite(value)) throw new RangeError(`${name} must be a finite number`);
  return value;
}

function positive(name: string, value: unknown): number {
  const parsed = numberValue(name, value);
  if (parsed <= 0) throw new RangeError(`${name} must be positive`);
  return parsed;
}

function booleanValue(name: string, value: unknown): boolean {
  if (typeof value !== "boolean") throw new RangeError(`${name} must be boolean`);
  return value;
}

const average = (beginning: number, ending: number): number => (beginning + ending) / 2;
const clean = (value: number): number => {
  const rounded = Math.round((value + Number.EPSILON) * 1e12) / 1e12;
  return Object.is(rounded, -0) ? 0 : rounded;
};

export function dupontDecomposition(input: Inputs): Output {
  const income = numberValue("net_income", input.net_income);
  const revenue = numberValue("revenue", input.revenue);
  const averageAssets = average(numberValue("beginning_assets", input.beginning_assets), numberValue("ending_assets", input.ending_assets));
  const averageEquity = average(numberValue("beginning_equity", input.beginning_equity), numberValue("ending_equity", input.ending_equity));
  if (revenue === 0 || averageAssets <= 0 || averageEquity <= 0) {
    const reasons: string[] = [];
    if (revenue === 0) reasons.push("zero-revenue");
    if (averageAssets <= 0) reasons.push("nonpositive-average-assets");
    if (averageEquity <= 0) reasons.push("nonpositive-average-equity");
    return { net_profit_margin: null, asset_turnover: null, equity_multiplier: null, dupont_roe: null, direct_roe: null, identity_gap: null,
      average_assets: clean(averageAssets), average_equity: clean(averageEquity), state: "not-meaningful", reason: reasons.join("+") };
  }
  const margin = income / revenue;
  const turnover = revenue / averageAssets;
  const multiplier = averageAssets / averageEquity;
  const dupontRoe = margin * turnover * multiplier;
  const directRoe = income / averageEquity;
  return { net_profit_margin: clean(margin), asset_turnover: clean(turnover), equity_multiplier: clean(multiplier), dupont_roe: clean(dupontRoe),
    direct_roe: clean(directRoe), identity_gap: clean(dupontRoe - directRoe), average_assets: clean(averageAssets), average_equity: clean(averageEquity),
    state: income < 0 ? "loss" : "calculated", reason: "three-factor-identity-reconciles" };
}

export function roicCalculation(input: Inputs): Output {
  const profit = numberValue("operating_profit", input.operating_profit);
  const taxRate = numberValue("normalized_tax_rate", input.normalized_tax_rate);
  if (taxRate < 0 || taxRate > 1) throw new RangeError("normalized_tax_rate must be between 0 and 1");
  const capitalBegin = numberValue("beginning_operating_assets", input.beginning_operating_assets) - numberValue("beginning_operating_liabilities", input.beginning_operating_liabilities);
  const capitalEnd = numberValue("ending_operating_assets", input.ending_operating_assets) - numberValue("ending_operating_liabilities", input.ending_operating_liabilities);
  const averageCapital = average(capitalBegin, capitalEnd);
  const nopat = profit * (1 - taxRate);
  if (averageCapital <= 0) return { nopat: clean(nopat), beginning_invested_capital: clean(capitalBegin), ending_invested_capital: clean(capitalEnd),
    average_invested_capital: clean(averageCapital), roic: null, state: "not-meaningful", reason: "nonpositive-average-invested-capital" };
  return { nopat: clean(nopat), beginning_invested_capital: clean(capitalBegin), ending_invested_capital: clean(capitalEnd),
    average_invested_capital: clean(averageCapital), roic: clean(nopat / averageCapital), state: nopat < 0 ? "loss" : "calculated",
    reason: "package-operating-capital-definition" };
}

export function cashConversionCycle(input: Inputs): Output {
  const revenue = numberValue("revenue", input.revenue);
  const cogs = numberValue("cost_of_goods_sold", input.cost_of_goods_sold);
  const days = positive("day_count", input.day_count);
  const receivablesBegin = numberValue("beginning_receivables", input.beginning_receivables);
  const receivablesEnd = numberValue("ending_receivables", input.ending_receivables);
  const inventoryBegin = numberValue("beginning_inventory", input.beginning_inventory);
  const inventoryEnd = numberValue("ending_inventory", input.ending_inventory);
  const payablesBegin = numberValue("beginning_trade_payables", input.beginning_trade_payables);
  const payablesEnd = numberValue("ending_trade_payables", input.ending_trade_payables);
  if (Math.min(receivablesBegin, receivablesEnd, inventoryBegin, inventoryEnd, payablesBegin, payablesEnd) < 0) throw new RangeError("working-capital balances must be nonnegative");
  const receivables = average(receivablesBegin, receivablesEnd);
  const inventory = average(inventoryBegin, inventoryEnd);
  const payables = average(payablesBegin, payablesEnd);
  if (revenue <= 0 || cogs <= 0) return { average_receivables: clean(receivables), average_inventory: clean(inventory), average_trade_payables: clean(payables),
    days_sales_outstanding: null, days_inventory_outstanding: null, days_payables_outstanding: null, cash_conversion_cycle_days: null,
    state: "not-meaningful", reason: revenue <= 0 ? "nonpositive-revenue" : "nonpositive-cogs" };
  const dso = receivables / revenue * days;
  const dio = inventory / cogs * days;
  const dpo = payables / cogs * days;
  const ccc = dio + dso - dpo;
  return { average_receivables: clean(receivables), average_inventory: clean(inventory), average_trade_payables: clean(payables),
    days_sales_outstanding: clean(dso), days_inventory_outstanding: clean(dio), days_payables_outstanding: clean(dpo),
    cash_conversion_cycle_days: clean(ccc), state: ccc < 0 ? "negative-cycle" : "calculated", reason: "dio-plus-dso-minus-dpo" };
}

export function interestCoverageRatio(input: Inputs): Output {
  const ebit = numberValue("ebit", input.ebit);
  const interest = numberValue("gross_interest_expense", input.gross_interest_expense);
  if (interest <= 0) return { ebit: clean(ebit), gross_interest_expense: clean(interest), interest_coverage_ratio: null,
    coverage_shortfall: null, state: "not-meaningful", reason: "nonpositive-gross-interest-expense" };
  const ratio = ebit / interest;
  return { ebit: clean(ebit), gross_interest_expense: clean(interest), interest_coverage_ratio: clean(ratio),
    coverage_shortfall: clean(Math.max(0, interest - ebit)), state: ratio >= 1 ? "covered" : "not-covered",
    reason: "ebit-divided-by-gross-interest-expense" };
}

export function netDebtToEbitda(input: Inputs): Output {
  const income = numberValue("net_income", input.net_income);
  const interest = numberValue("interest_expense", input.interest_expense);
  const tax = numberValue("income_tax_expense", input.income_tax_expense);
  const da = numberValue("depreciation_and_amortization", input.depreciation_and_amortization);
  const currentDebt = numberValue("current_borrowings", input.current_borrowings);
  const noncurrentDebt = numberValue("noncurrent_borrowings", input.noncurrent_borrowings);
  const leases = numberValue("lease_liabilities", input.lease_liabilities);
  const cash = numberValue("cash_and_cash_equivalents", input.cash_and_cash_equivalents);
  const includeLeases = booleanValue("include_lease_liabilities", input.include_lease_liabilities);
  if (Math.min(interest, da, currentDebt, noncurrentDebt, leases, cash) < 0) throw new RangeError("debt, cash, interest, and D&A inputs must be nonnegative");
  const ebitda = income + interest + tax + da;
  const grossDebt = currentDebt + noncurrentDebt + (includeLeases ? leases : 0);
  const netDebt = grossDebt - cash;
  if (ebitda <= 0) return { ebitda: clean(ebitda), gross_debt: clean(grossDebt), net_debt: clean(netDebt), net_debt_to_ebitda: null,
    lease_policy: includeLeases ? "included" : "excluded", state: "not-meaningful", reason: "nonpositive-ebitda" };
  return { ebitda: clean(ebitda), gross_debt: clean(grossDebt), net_debt: clean(netDebt), net_debt_to_ebitda: clean(netDebt / ebitda),
    lease_policy: includeLeases ? "included" : "excluded", state: netDebt < 0 ? "net-cash" : "net-debt", reason: "net-debt-divided-by-ebitda" };
}

interface Item { label: string; value: number }
interface Period { period: string; items: Item[] }

export function commonSizeStatements(input: Inputs): Output {
  const statementType = input.statement_type;
  if (statementType !== "income" && statementType !== "balance") throw new RangeError("statement_type must be 'income' or 'balance'");
  const baseLabel = input.base_label;
  const focusLabel = input.focus_label;
  if (typeof baseLabel !== "string" || !baseLabel.trim()) throw new RangeError("base_label must be a nonempty string");
  if (typeof focusLabel !== "string" || !focusLabel.trim()) throw new RangeError("focus_label must be a nonempty string");
  if (!Array.isArray(input.periods) || input.periods.length < 2) throw new RangeError("periods must contain at least two period objects");
  let expectedLabels: string[] | null = null;
  let previousFocus: number | null = null;
  const normalizedPeriods = (input.periods as unknown[]).map((rawPeriod, periodIndex) => {
    if (!rawPeriod || typeof rawPeriod !== "object") throw new RangeError(`periods[${periodIndex}] must be an object`);
    const period = rawPeriod as Record<string, unknown>;
    if (typeof period.period !== "string" || !period.period.trim()) throw new RangeError(`periods[${periodIndex}].period must be a nonempty string`);
    if (!Array.isArray(period.items) || period.items.length < 4) throw new RangeError(`periods[${periodIndex}].items must contain at least four rows`);
    const seen = new Set<string>();
    const parsed = (period.items as unknown[]).map((rawItem, itemIndex): Item => {
      if (!rawItem || typeof rawItem !== "object") throw new RangeError(`periods[${periodIndex}].items[${itemIndex}] must be an object`);
      const item = rawItem as Record<string, unknown>;
      if (typeof item.label !== "string" || !item.label.trim() || seen.has(item.label)) throw new RangeError("statement item labels must be nonempty and unique within a period");
      seen.add(item.label);
      return { label: item.label, value: numberValue(`${period.period}.${item.label}`, item.value) };
    });
    const labels = parsed.map((item) => item.label);
    if (expectedLabels === null) expectedLabels = labels;
    else if (labels.join("\u0000") !== expectedLabels.join("\u0000")) throw new RangeError("every period must use the same ordered line-item labels");
    const values = Object.fromEntries(parsed.map((item) => [item.label, item.value]));
    if (!(baseLabel in values) || !(focusLabel in values)) throw new RangeError("base_label and focus_label must exist in every period");
    const base = values[baseLabel];
    if (base === 0 || (statementType === "balance" && base < 0)) throw new RangeError("the common-size base must be nonzero and positive for balance sheets");
    const focusPercentage = values[focusLabel] / base * 100;
    const result = { period: (period.period as string).trim(), base_value: clean(base), focus_percentage: clean(focusPercentage),
      focus_change_pp: previousFocus === null ? null : clean(focusPercentage - previousFocus),
      items: parsed.map((item) => ({ label: item.label, value: clean(item.value), common_size_pct: clean(item.value / base * 100) })) };
    previousFocus = focusPercentage;
    return result;
  });
  const latest = normalizedPeriods[normalizedPeriods.length - 1];
  return { statement_type: statementType, base_label: baseLabel, focus_label: focusLabel, period_count: normalizedPeriods.length,
    line_item_count: normalizedPeriods[0].items.length, focus_percentage: latest.focus_percentage, focus_change_pp: latest.focus_change_pp,
    periods: normalizedPeriods, state: "calculated", reason: "signed-line-items-divided-by-period-base" };
}

export function calculate(topicId: string, input: Inputs): Output {
  if (!input || typeof input !== "object" || Array.isArray(input)) throw new RangeError("inputs must be an object");
  switch (topicId) {
    case "D18-F01-A01": return dupontDecomposition(input);
    case "D18-F01-A02": return roicCalculation(input);
    case "D18-F01-A03": return cashConversionCycle(input);
    case "D18-F01-A04": return interestCoverageRatio(input);
    case "D18-F01-A05": return netDebtToEbitda(input);
    case "D18-F01-A06": return commonSizeStatements(input);
    default: throw new RangeError(`unsupported topic_id: ${topicId}`);
  }
}
The embedded lab now expands to its full document height, keeping the article as the only scroll surface.