
 By Islam Baraka
For analysts and developers who know decimal log returns, sample variance, and consistently adjusted OHLC bars. The goal is to reproduce the mechanism, inspect its failure states, and decide what the output can legitimately tell you—not to fit or endorse a trading strategy.
Imagine two sessions that both open and close at 100. In one, the price stays between 99.9 and 100.1. In the other, it travels between 95 and 105. A close-only return treats them identically. Parkinson volatility uses the high and low to distinguish them.
The practical lesson is not “more price fields always make a better estimator.” It is that the range contains information about a path that its endpoints discard. You need reliable extrema and a model under which that information can be interpreted.
This tutorial builds the range contribution, exposes its assumptions, and shows how to tell a legitimate estimator disagreement from a bad candle. Familiarity with log returns and averaging is enough.
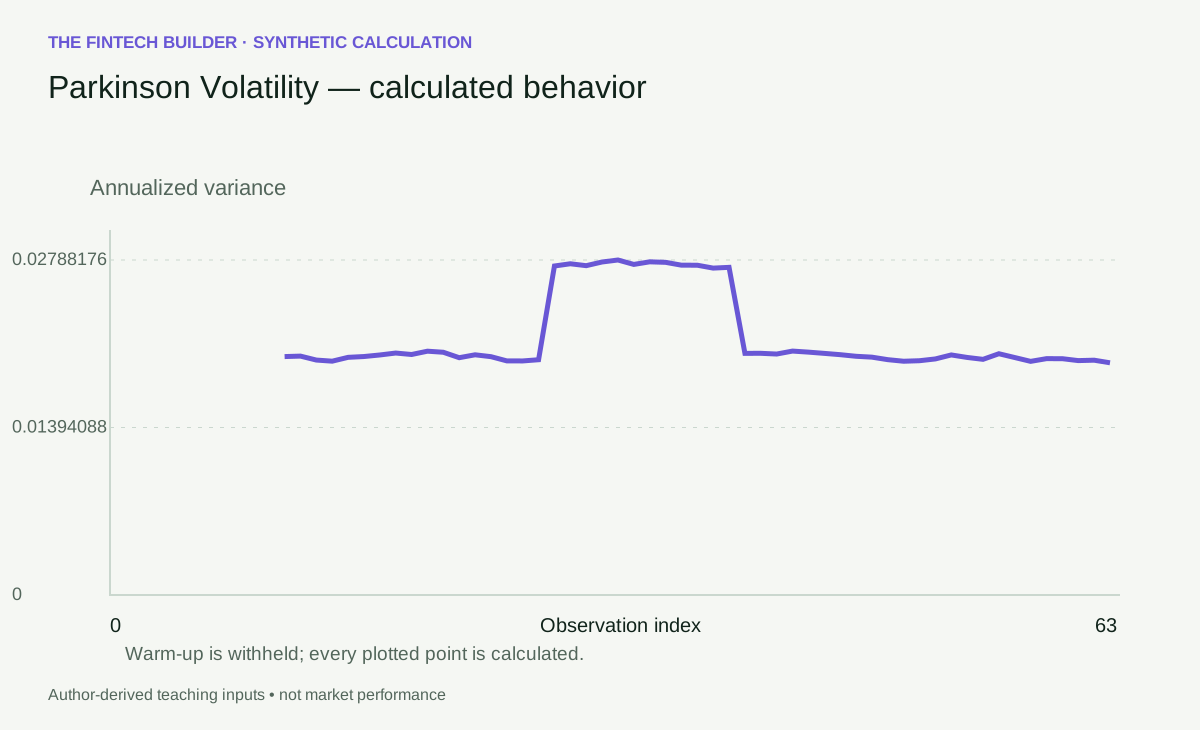
Open this figure at full size.
Turn a range into a variance contribution
For one session, define R=ln(H/L), where H and L are that session's positive high and low. Its Parkinson contribution is R²/(4ln2). Average the contributions over w sessions, multiply by A if annualizing, and take a square root only when you want volatility rather than variance. The formula is documented in the TTR volatility reference.
The logarithm makes the range scale-free: multiplying every price by ten does not change H/L. The square makes a large relative range matter disproportionately. The constant comes from the classic continuous, driftless price-path model; it is not an arbitrary display normalization.
Open and close do not appear in the calculation. We still validate that the OHLC record is internally consistent, because a high below the close is evidence of a malformed input. Validating a field and using it in an estimator are different operations.
Check a synthetic candle yourself
Let the high be 100e^0.01 and the low be 100e^−0.015. The log range is exactly 0.025, or2.5 log-percentage points. The contribution is 0.000625/(4ln2), approximately 0.0002254211.
Use two candles with the same relative high/low geometry and w=2. Their mean contribution is unchanged. With A=1, the corresponding volatility is approximately 1.50140%. With A=252, multiply the variance by 252; do not multiply volatility by 252. Its multiplier is √252.
Now double the log range from 0.025 to 0.05. The variance contribution quadruples. The volatility contribution doubles if the rest of the construction remains the same. This is a useful unit test and a useful mental model for an unusually wide candle.
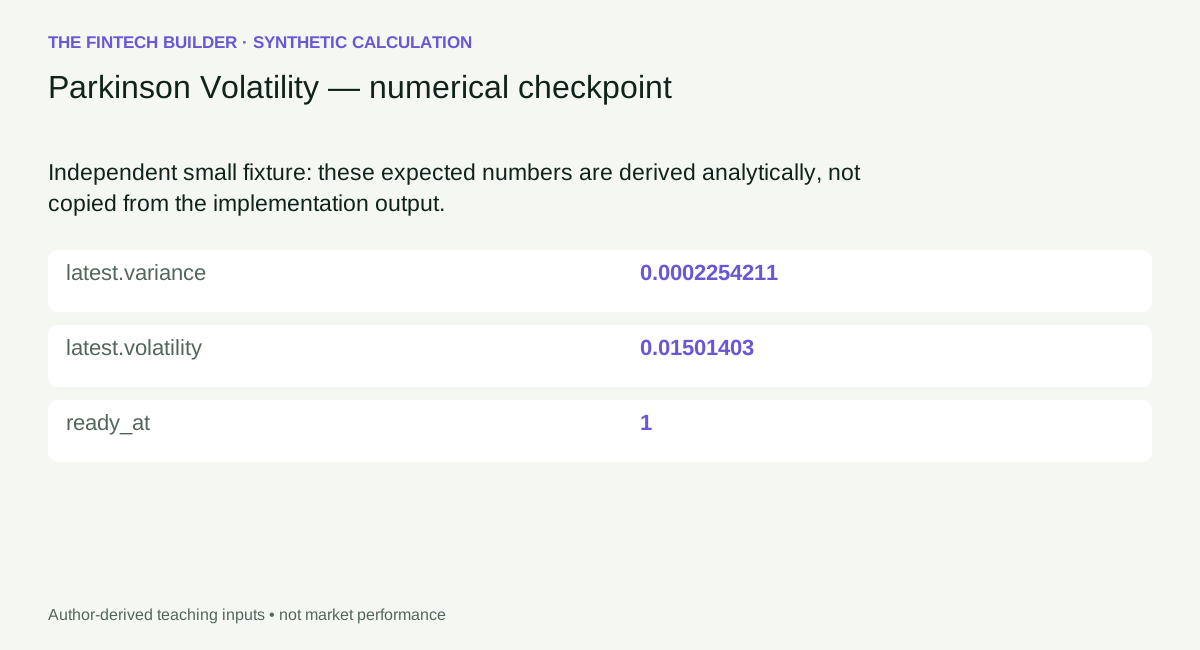
Open this figure at full size.
Download the exact worked input and expected values.
Why opening gaps are a separate problem
Suppose yesterday's close was 100 and today's entire session trades close to 110, with a high of 110.1 and a low of 109.9. Today's high/low ratio is near one. Parkinson can produce a small contribution despite the large move between yesterday's close and today's open.
The estimator has not forgotten an input: it never received the previous close. If overnight exposure matters, compare against close-to-close returns or use an estimator that explicitly includes opening gaps. Do not “repair” Parkinson by silently changing the low to yesterday's close. That creates a different statistic.
The same question applies to session construction. A regular-hours range and a 24-hour range measure different paths. State which trades define the extrema and which clock defines the session before comparing assets or data vendors.
Range information can also be bad information
An erroneous high has outsized influence because the log range is squared. A single stale or off-market print can contaminate a daily candle even when the close is credible. Sparse trading can create the opposite problem: observed extrema may miss much of a continuous latent path.
Large directional drift and discontinuous jumps also challenge the classical interpretation. The arithmetic still produces a number for valid candles. That is not the same as the statistical model being appropriate. Never convert “the code accepted the record” into “the estimator's assumptions were verified.”
| Your main question | Prefer as a starting point | Why |
|---|---|---|
| What dispersed between closes? | Close-to-close | Minimal, auditable endpoint data |
| What did the same-session range reveal? | Parkinson | High/low information is the mechanism |
| Does strong directional drift matter? | Rogers–Satchell comparison | Different within-session construction |
| Where did overnight risk enter? | Yang–Zhang | Explicit gap component |
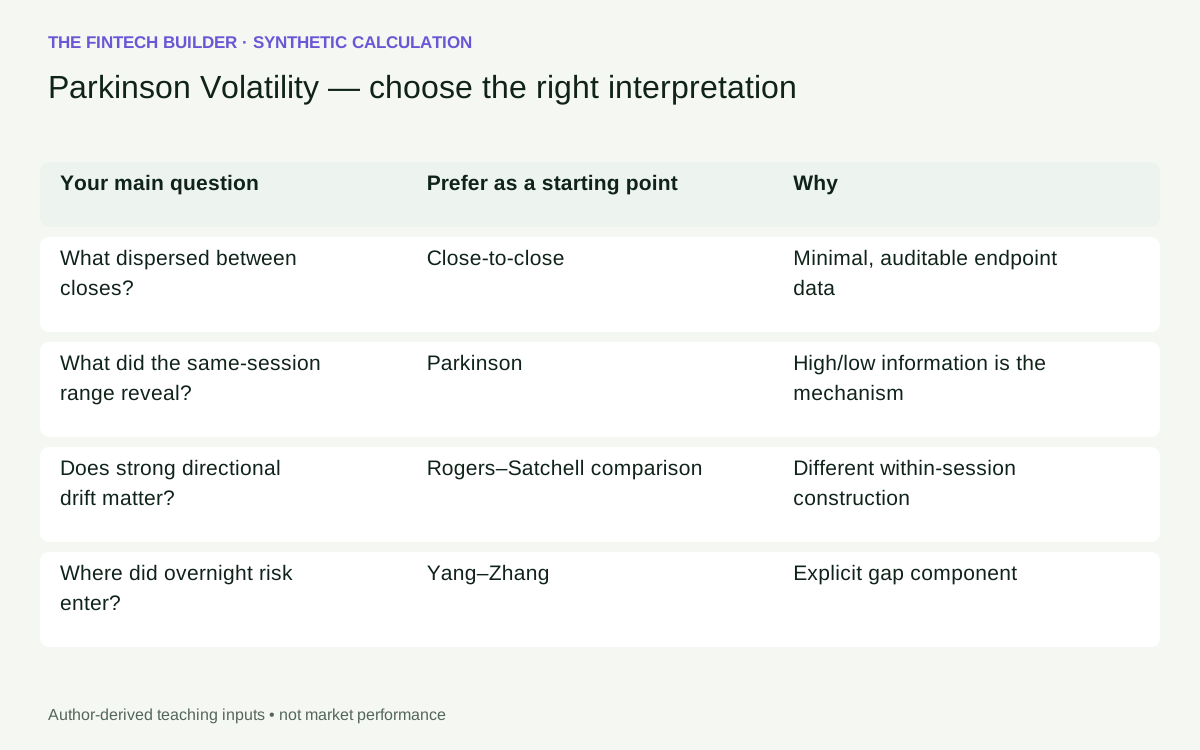
Open this figure at full size.
The playground experiment
Use the same 64-bar path while changing the window. Step through an enlarged range and watch the contribution enter the mean. Continue until it exits. The contribution table makes the averaging boundary visible; the plot is generated from those calculations.
Compare the quiet/flat boundary with the malformed-bar scenario. Equal high and low, with open and close at that price, is a valid zero-range observation. A high below the open is invalid, not a negative range observation to be averaged away.
Before changing a control, predict whether it changes the range of a bar, the number of bars being averaged, or only the annualization scale. Those are three different mechanisms. The lab labels synthetic inputs so none of its visual patterns can be mistaken for observed market behavior.
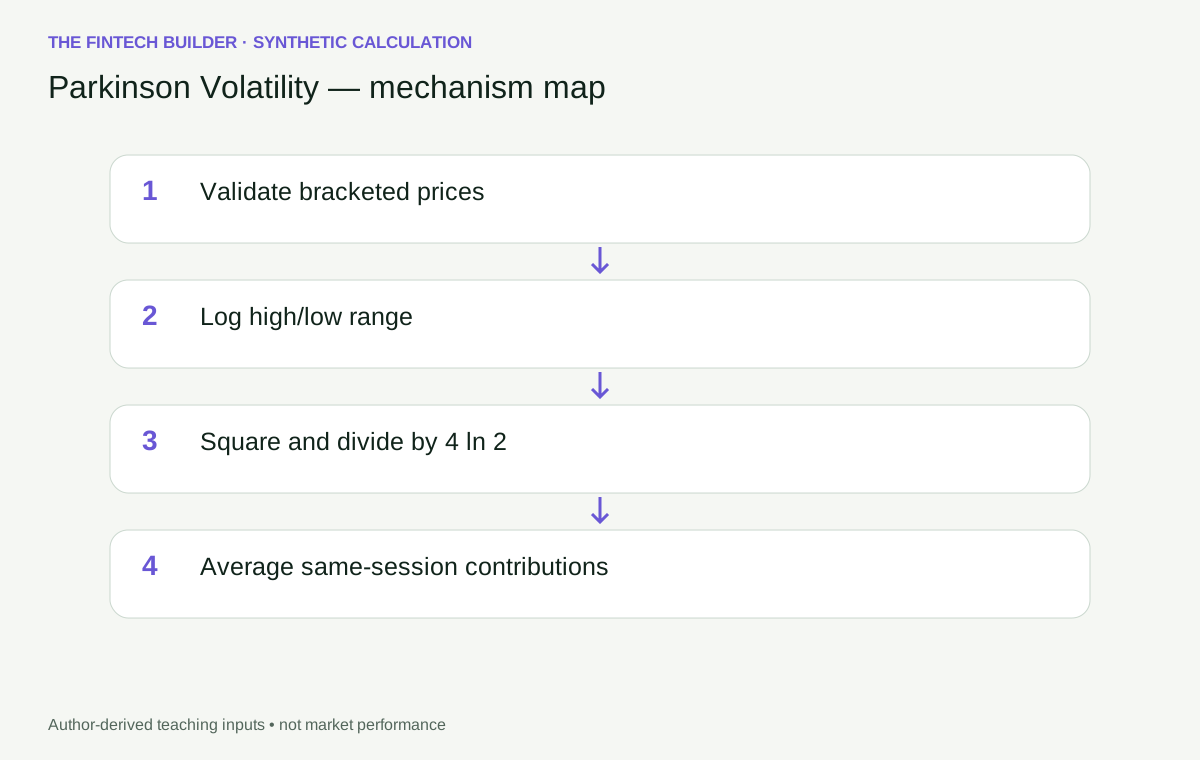
Open this figure at full size.
Open the standalone guided playground. The embedded playground and runnable code are available on this page. Download the 64-observation teaching input.
What the implementation deliberately does not do
It does not adjust corporate actions, select a market session, remove outliers, or estimate a future volatility distribution. Those choices belong upstream and need evidence. All four OHLC fields must share one adjustment basis; mixing an adjusted low with an unadjusted high can create a fictitious range.
The first valid output needs w complete bars, not w+1, because no previous close enters the formula. There is no partial-window shortcut. Parameters are finite numbers, the window is an integer at least two, and annualization must be positive. The code returns the individual contributions alongside the result so you can audit an apparent spike.
For a real risk process, retain a range-quality flag and the comparison to a close-based baseline. Parkinson's value is the additional path information it exposes. Its limitation is that it cannot tell you whether an extreme print was economically meaningful or whether its continuous-path model described that session.
Continue with Garman–Klass to see how the candle body changes a range-based estimate.
Reproduce and inspect the calculation
The Python and TypeScript tabs contain standalone implementations, not imports into an unseen runtime. Both expose calculate(input_data). Feed the worked JSON's input object into that entry point. For the longer experiment, use the teaching-path JSON directly.
import json
from pathlib import Path
from parkinson_volatility import calculate

data = json.loads(Path("teaching-path.json").read_text())
result = calculate(data)
print(result["latest"])
import {calculate} from './parkinson_volatility.ts';
const result = calculate(inputData); // inputData is the downloaded JSON object
console.log(result.latest);
Place the downloaded input beside your script and the standalone source on its import path. The Python reference uses the standard library; the TypeScript reference has no external runtime dependency. Shared tests include independent numeric anchors, valid boundaries, rejected inputs and cross-language output comparisons. They establish arithmetic, not forecasting performance.
Evidence and scope
This article uses authored synthetic calculations and primary technical references, reviewed 2026-09-10. Historical market examples are deferred until identity, adjustment basis, chronology and redistribution rights can be verified. No personal trading history or search-ranking superiority is asserted.
w same-session OHLC bars; classical continuous, driftless range model; no overnight term.
- TTR — volatility: close and range estimator conventions
- Parkinson — The Extreme Value Method for Estimating the Variance of the Rate of Return (1980)
Continue the investigation
- Close-to-Close Volatility: compare its assumptions and information boundary before comparing the numbers.
- Yang-Zhang Volatility: compare its assumptions and information boundary before comparing the numbers.
Rendered from the canonical Mermaid sources linked by this article.
Parkinson Volatility — calculation-flow
Parkinson Volatility — decision-boundary
ReferencesPrimary sources and evidence notesExpand the source trail, evidence role, and limitations behind the engineering choices.
Expand the source trail, evidence role, and limitations behind the engineering choices.
Reviewed 2026-09-10. Primary technical documentation and papers; synthetic arithmetic is author-derived. This is a targeted source review, not a verified review of Google's top ten results and not a claim of ranking superiority.
- S1: TTR — volatility: close and range estimator conventions — accessed 2026-09-10. Rolling official documentation snapshot; exact package versions used for numerical comparisons are recorded in the repair numeric-evidence.json. Supports the definition and declared convention, not investment performance. Jurisdiction: not applicable to this mathematical reference.
- S2: Parkinson — The Extreme Value Method for Estimating the Variance of the Rate of Return (1980) — accessed 2026-09-10. Original research publication; not a current market observation. Supports the definition and declared convention, not investment performance. Jurisdiction: not applicable to this mathematical reference.
Scope of evidence
w same-session OHLC bars; classical continuous, driftless range model; no overnight term.
Historical case: deferred. No public provider dataset, historical performance claim, or personal trading anecdote is used. Synthetic examples demonstrate arithmetic, not market efficacy. Sources are not copied as article prose.
Accessed: 2026-09-10.
Supports: estimator definition and the explicitly declared variants.
Limitations: technical documentation does not verify a real market feed, author experience, forecast efficacy or search-result superiority. Original-paper access limitations are recorded in the repair report.
Full dependency-light reference implementations in both supported languages.
/** Standalone D10-F01-A02 reference. Generated from validated D10 v2 source. */
export class ContractError extends Error {}
type RecordValue=Record<string, any>;
type Matrix=number[][];
const sum=(x:number[]):number=>x.reduce((a,b)=>a+b,0);


function requireValue(ok: unknown, code: string, message: string): asserts ok {
  if (!ok) throw new ContractError(`${code}: ${message}`);
}

function finite(x: unknown, name: string): number {
  requireValue(typeof x === 'number' && Number.isFinite(x), 'NUMBER', `${name} must be a finite number`);
  return x;
}

function integer(x: unknown, name: string, minimum = 0, maximum = 10000): number {
  const v = finite(x, name);
  requireValue(Number.isInteger(v) && v >= minimum && v <= maximum, 'INTEGER', `${name} must be an integer in [${minimum}, ${maximum}]`);
  return v;
}

function param(p: RecordValue, key: string, fallback: number): number {
  return finite(Object.hasOwn(p, key) ? p[key] : fallback, key);
}

function option(p: RecordValue, key: string, fallback: any): any {
  return Object.hasOwn(p, key) ? p[key] : fallback;
}

function positive(p: RecordValue, key: string, fallback: number): number {
  const v = param(p, key, fallback);
  requireValue(v > 0, 'RANGE', `${key} must be positive`);
  return v;
}

function timestamps(values: unknown, n: number, name: string, regular = false): number[] {
  requireValue(Array.isArray(values) && values.length === n, 'TIME', `${name} must match observation count`);
  const result: number[] = [];
  for (const value of values) {
    requireValue(typeof value === 'string' && /^\d{4}-\d{2}-\d{2}T\d{2}:\d{2}:\d{2}(?:\.\d{3})?Z$/.test(value), 'TIME', 'use UTC ISO timestamps');
    const instant = Date.parse(value);
    const canonical = value.length === 20 ? value.replace('Z', '.000Z') : value;
    requireValue(Number.isFinite(instant) && Number(value.slice(0, 4)) >= 1000 && new Date(instant).toISOString() === canonical, 'TIME', 'invalid calendar timestamp');
    requireValue(!result.length || instant > result[result.length - 1], 'TIME', 'timestamps must strictly increase');
    result.push(instant);
  }
  if (regular && n > 2) requireValue(result.slice(2).every((v, i) => v - result[i + 1] === result[1] - result[0]), 'ALIGNMENT', 'returns need a regular grid');
  return result;
}

function bars(data: RecordValue): any[][] {
  const values = data.bars;
  requireValue(Array.isArray(values) && values.length >= 2 && values.every(b => b && typeof b === 'object' && !Array.isArray(b)), 'SHAPE', 'bars needs at least two OHLC objects');
  timestamps(values.map(b => b.timestamp), values.length, 'bars.timestamp');
  return values.map(b => {
    const [o, h, l, c] = ['open', 'high', 'low', 'close'].map(k => finite(b[k], k));
    requireValue(Math.min(o, h, l, c) > 0 && h >= Math.max(o, c) && l <= Math.min(o, c), 'OHLC', 'positive bracketed OHLC required');
    return [b.timestamp, o, h, l, c];
  });
}

function variance(x: number[]): number {
  const mean = sum(x) / x.length;
  return sum(x.map(v => (v - mean) ** 2)) / (x.length - 1);
}

function seriesResult(series: (RecordValue | null)[], diagnostics: RecordValue): RecordValue {
  const at = series.findIndex(v => v !== null);
  return {series, latest: series.at(-1) ?? null, ready: series.length > 0 && series.at(-1) !== null,
    ready_at: at < 0 ? null : at, diagnostics};
}

function historical(data: RecordValue, p: RecordValue, kind: string): RecordValue {
  const values = bars(data), w = integer(option(p, 'window', 12), 'window', 2), scale = positive(p, 'annualization_factor', 252);
  const contributions = values.map(([, o, h, l, c], i) => {
    const rs = Math.log(h / c) * Math.log(h / o) + Math.log(l / c) * Math.log(l / o);
    const choices: RecordValue = {
      close_to_close: i === 0 ? null : Math.log(c / values[i - 1][4]),
      parkinson: Math.log(h / l) ** 2 / (4 * Math.log(2)),
      garman_klass: .5 * Math.log(h / l) ** 2 - (2 * Math.log(2) - 1) * Math.log(c / o) ** 2,
      rogers_satchell: rs,
      yang_zhang: [i === 0 ? null : Math.log(o / values[i - 1][4]), Math.log(c / o), rs],
    };
    return choices[kind];
  });
  const series = values.map((bar, i) => {
    const block = contributions.slice(Math.max(0, i - w + 1), i + 1);
    if (block.length < w || block.some(v => v === null) || (kind === 'yang_zhang' && block[0][0] === null)) return null;
    let estimate: number, components: RecordValue = {};
    if (kind === 'yang_zhang') {
      const overnight = variance(block.map(v => v[0])), intraday = variance(block.map(v => v[1]));
      const rs = sum(block.map(v => v[2])) / w, k = .34 / (1.34 + (w + 1) / (w - 1));
      estimate = scale * (overnight + k * intraday + (1 - k) * rs);
      components = {overnight: scale * overnight, open_close: scale * k * intraday, range: scale * (1 - k) * rs, k};
    } else estimate = scale * (kind === 'close_to_close' ? variance(block) : sum(block) / w);
    requireValue(estimate >= 0, 'NUMERIC', 'negative variance: inspect inputs and precision');
    return {timestamp: bar[0], variance: estimate, volatility: Math.sqrt(estimate), contributions: block, components, window_start: i - w + 1, window_end: i};
  });
  return seriesResult(series, {input_count: values.length, annualization_factor: scale, causal: true});
}
export function calculate(data: RecordValue): RecordValue {
  requireValue(data && typeof data === 'object' && !Array.isArray(data),'SHAPE','input must be an object');
  const p=Object.hasOwn(data,'parameters')?data.parameters:{};
  requireValue(p && typeof p === 'object' && !Array.isArray(p),'SHAPE','parameters must be an object');
  const result=historical(data,p,"parkinson");
  function check(v:any):void {
    if(typeof v==='number')requireValue(Number.isFinite(v),'NUMERIC','nonfinite computed output');
    else if(Array.isArray(v))v.forEach(check);
    else if(v && typeof v==='object')Object.values(v).forEach(check);
  }
  check(result);
  return {topic_id:"D10-F01-A02",title:"Parkinson Volatility",parameters:p,...result};
}
The embedded lab now expands to its full document height, keeping the article as the only scroll surface.