
 By Islam Baraka
For analysts and developers who know decimal log returns, sample variance, and consistently adjusted OHLC bars. The goal is to reproduce the mechanism, inspect its failure states, and decide what the output can legitimately tell you—not to fit or endorse a trading strategy.
A strong trend creates an awkward teaching problem: a large move in one direction and repeated movement around a level are different path behaviors, even if both produce a wide candle. Rogers–Satchell is a within-session estimator designed to accommodate nonzero drift under its continuous-price model.
“Drift robust” is the beginning of the explanation, not the conclusion. It does not remove opening jumps, bad prints, or finite-sample uncertainty. Here you will calculate its two products and see exactly what information disappears at a candle's boundaries.
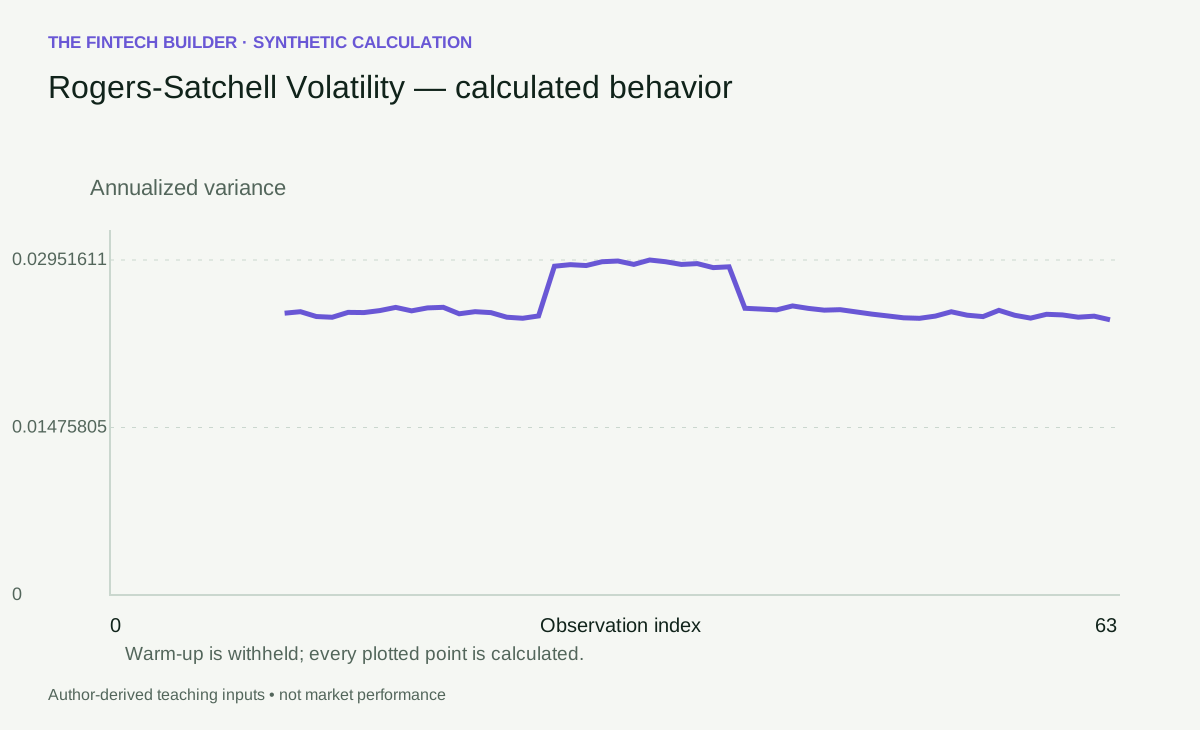
Open this figure at full size.
Start with four log distances
For positive, bracketed OHLC prices, the contribution is
The upper product relates the high to both endpoints. The lower product does the same for the low. Average these contributions across w bars, multiply by A for annualized variance, and take a square root for volatility. This convention appears in the TTR technical documentation.
The upper logarithms are nonnegative. Both lower logarithms are nonpositive, so their product is nonnegative too. Thus a correctly bracketed candle produces a nonnegative RS contribution. Keeping the lower logarithms' signs is essential; replacing only one of them by an absolute value would reverse that term.
Work through a candle without hiding the signs
Use synthetic log-price offsets: open−0.005, close 0, high+0.010 and low−0.015 relative to 100. The upper distances are 0.010 and 0.015, giving 0.00015. The lower distances are−0.015 and−0.010, also giving 0.00015.
Their sum is 0.0003. Two equal-geometry candles have the same average contribution. With A=1, volatility is √0.0003, approximately 1.73205%. Each number is independently encoded in the fixture so that a sign or denominator regression cannot pass merely because an output exists.
Notice that the upper and lower terms happen to match in this example. That is a chosen teaching symmetry, not a property of the estimator. Move the close toward the high and inspect how the two products change separately.
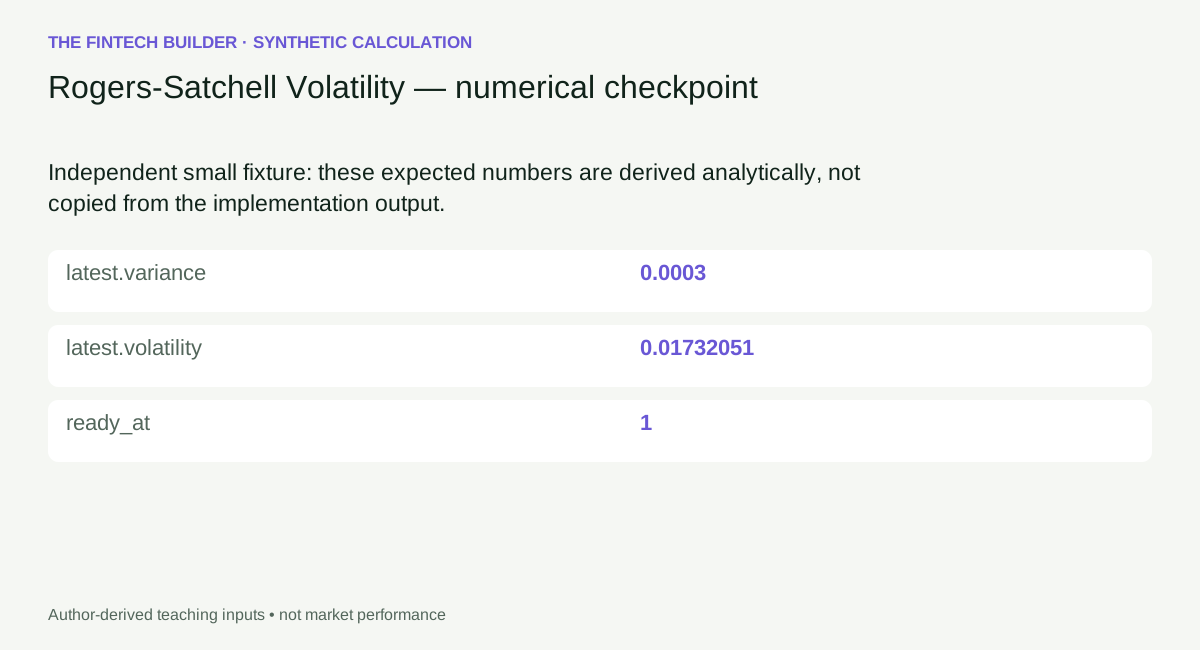
Open this figure at full size.
Download the exact worked input and expected values.
The monotone-candle boundary is especially revealing
Consider a candle opening at its low and closing at its high: O=L and C=H. Then ln(H/C)=0 and ln(L/O)=0. Both products vanish, so RS is zero even though the open-to-close return is positive and may be large.
That is not a proof that the asset had no economic risk. It is a boundary behavior of this estimator using only four observed prices. A continuous stochastic model's average properties do not require every individual candle to match your intuitive notion of risk. With sparse observations or strongly directional sessions, this distinction matters.
If your risk question concerns the size of a directional loss, inspect returns, drawdown, or exposure scenarios as well. No variance estimator can replace the question you intended to ask.
Drift robustness does not mean gap robustness
Previous close is absent from RS. The price can jump between sessions, trade in a narrow band, and produce a small within-session estimate. Yang–Zhang combines an RS range component with separate overnight and open-to-close dispersion terms.
The distinction is useful when two estimates disagree. If RS is modest but close-to-close volatility is high, inspect where the large moves occurred. Did they happen before the session opened? Did the price move almost monotonically? Are the two feeds using the same close? Diagnose those possibilities before calling either estimator wrong.
| Feature | Rogers–Satchell | Useful comparison |
|---|---|---|
| Nonzero within-session drift | Built into the classical motivation | Garman–Klass assumptions |
| Opening jump | No separate term | Yang–Zhang overnight component |
| Monotone O=L, C=H candle | Zero contribution | Close-to-close return remains nonzero |
| Same prices multiplied by ten | Unchanged | Any log-ratio implementation should agree |
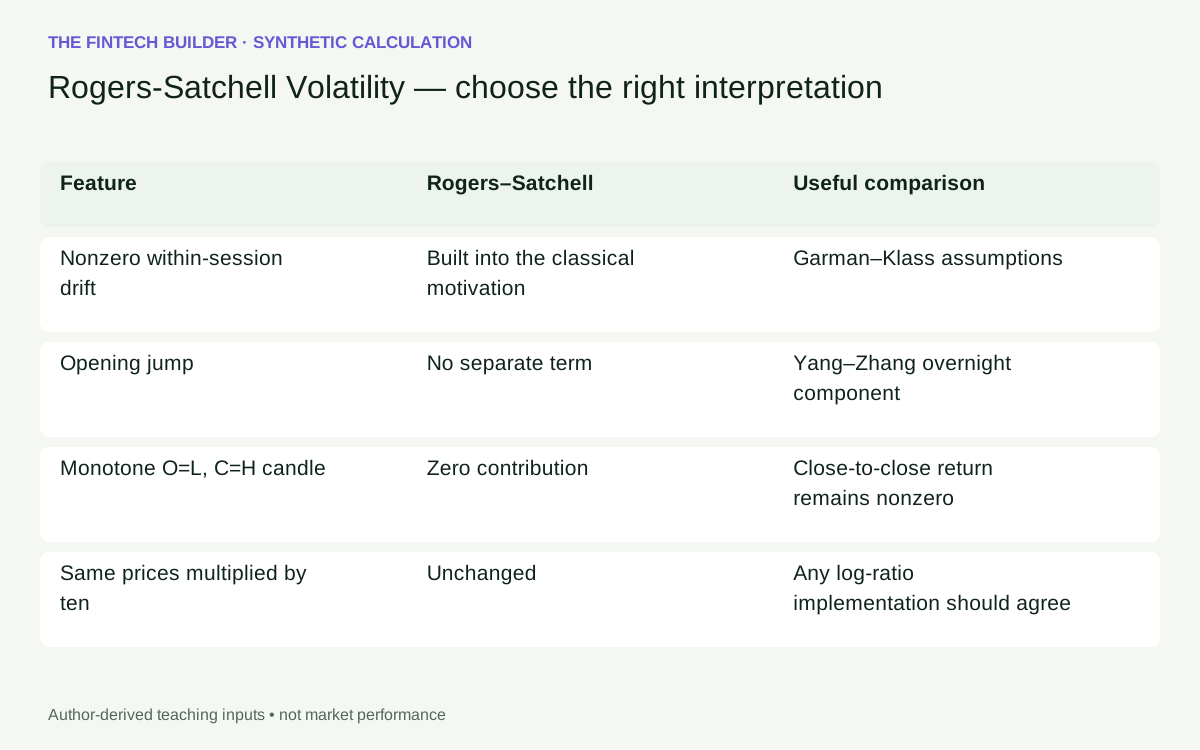
Open this figure at full size.
Make the two products visible in the lab
The playground steps through 64 synthetic observations, computes the current window, and exposes its actual contribution values. First inspect the two-product calculation on the small worked example. Then compare quiet, changed-input and invalid-input paths.
Shortening the window does not change an existing candle's RS contribution. It changes which contributions are averaged. That is a good prediction to make before touching the control. Step until the conspicuous candle exits and check the table, not just the line.
The invalid scenario tests a genuine OHLC contract violation. It must stop the calculation with an explanation. Reset restores the deterministic valid state. Back removes one observation from the prefix; it does not repair an invalid bar that remains in that prefix.
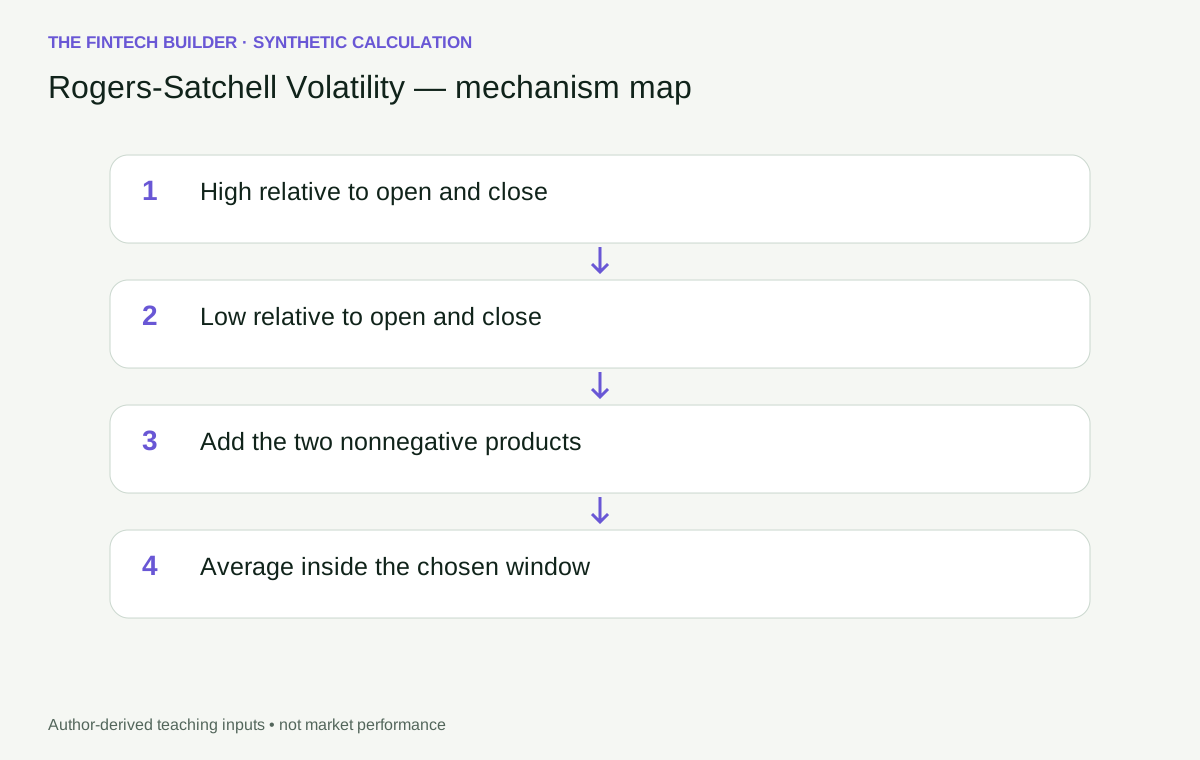
Open this figure at full size.
Open the standalone guided playground. The embedded playground and runnable code are available on this page. Download the 64-observation teaching input.
Data preparation is part of the estimate
High and low must come from the same session as open and close. All four prices must share the same corporate-action adjustment basis. A high from extended hours and a close from regular hours can describe a path different from the one the article assumes.
Bracketing checks cannot prove that an extreme trade was valid. Conversely, a wide range is not grounds to delete a candle automatically. Keep a record of corrections and exclusions, because changing an extremum changes the numerical explanation itself.
The first valid rolling output needs w bars. There is no prior-close dependency and no partial-window estimate. The implementation accepts an integer window, positive scaling factor, finite prices and strictly increasing real UTC timestamps. It does not infer exchange holidays or fill missing sessions.
What you should take away
RS is useful when you want a transparent within-session range estimate whose theoretical construction does not impose zero drift. Its value becomes tangible when you can point to the two products and explain a boundary candle. Its limits become tangible when you inspect an opening gap that the formula never sees.
Keep a close-based baseline and a gap-aware comparison nearby. Agreement can be reassuring, but disagreement often teaches you more about the path and the data than any single headline volatility number.
Reproduce and inspect the calculation
The Python and TypeScript tabs contain standalone implementations, not imports into an unseen runtime. Both expose calculate(input_data). Feed the worked JSON's input object into that entry point. For the longer experiment, use the teaching-path JSON directly.
import json
from pathlib import Path
from rogers_satchell_volatility import calculate

data = json.loads(Path("teaching-path.json").read_text())
result = calculate(data)
print(result["latest"])
import {calculate} from './rogers_satchell_volatility.ts';
const result = calculate(inputData); // inputData is the downloaded JSON object
console.log(result.latest);
Place the downloaded input beside your script and the standalone source on its import path. The Python reference uses the standard library; the TypeScript reference has no external runtime dependency. Shared tests include independent numeric anchors, valid boundaries, rejected inputs and cross-language output comparisons. They establish arithmetic, not forecasting performance.
Evidence and scope
This article uses authored synthetic calculations and primary technical references, reviewed 2026-09-10. Historical market examples are deferred until identity, adjustment basis, chronology and redistribution rights can be verified. No personal trading history or search-ranking superiority is asserted.
Drift-robust within-session estimator, not an overnight-gap estimator.
- TTR — volatility: close and range estimator conventions
- Rogers and Satchell — Estimating Variance from High, Low and Closing Prices (1991)
Continue the investigation
- Close-to-Close Volatility: compare its assumptions and information boundary before comparing the numbers.
- Yang-Zhang Volatility: compare its assumptions and information boundary before comparing the numbers.
Rendered from the canonical Mermaid sources linked by this article.
Rogers-Satchell Volatility — calculation-flow
Rogers-Satchell Volatility — decision-boundary
ReferencesPrimary sources and evidence notesExpand the source trail, evidence role, and limitations behind the engineering choices.
Expand the source trail, evidence role, and limitations behind the engineering choices.
Reviewed 2026-09-10. Primary technical documentation and papers; synthetic arithmetic is author-derived. This is a targeted source review, not a verified review of Google's top ten results and not a claim of ranking superiority.
- S1: TTR — volatility: close and range estimator conventions — accessed 2026-09-10. Rolling official documentation snapshot; exact package versions used for numerical comparisons are recorded in the repair numeric-evidence.json. Supports the definition and declared convention, not investment performance. Jurisdiction: not applicable to this mathematical reference.
- S2: Rogers and Satchell — Estimating Variance from High, Low and Closing Prices (1991) — accessed 2026-09-10. Original research publication; not a current market observation. Supports the definition and declared convention, not investment performance. Jurisdiction: not applicable to this mathematical reference.
Scope of evidence
Drift-robust within-session estimator, not an overnight-gap estimator.
Historical case: deferred. No public provider dataset, historical performance claim, or personal trading anecdote is used. Synthetic examples demonstrate arithmetic, not market efficacy. Sources are not copied as article prose.
Accessed: 2026-09-10.
Supports: estimator definition and the explicitly declared variants.
Limitations: technical documentation does not verify a real market feed, author experience, forecast efficacy or search-result superiority. Original-paper access limitations are recorded in the repair report.
Full dependency-light reference implementations in both supported languages.
/** Standalone D10-F01-A04 reference. Generated from validated D10 v2 source. */
export class ContractError extends Error {}
type RecordValue=Record<string, any>;
type Matrix=number[][];
const sum=(x:number[]):number=>x.reduce((a,b)=>a+b,0);


function requireValue(ok: unknown, code: string, message: string): asserts ok {
  if (!ok) throw new ContractError(`${code}: ${message}`);
}

function finite(x: unknown, name: string): number {
  requireValue(typeof x === 'number' && Number.isFinite(x), 'NUMBER', `${name} must be a finite number`);
  return x;
}

function integer(x: unknown, name: string, minimum = 0, maximum = 10000): number {
  const v = finite(x, name);
  requireValue(Number.isInteger(v) && v >= minimum && v <= maximum, 'INTEGER', `${name} must be an integer in [${minimum}, ${maximum}]`);
  return v;
}

function param(p: RecordValue, key: string, fallback: number): number {
  return finite(Object.hasOwn(p, key) ? p[key] : fallback, key);
}

function option(p: RecordValue, key: string, fallback: any): any {
  return Object.hasOwn(p, key) ? p[key] : fallback;
}

function positive(p: RecordValue, key: string, fallback: number): number {
  const v = param(p, key, fallback);
  requireValue(v > 0, 'RANGE', `${key} must be positive`);
  return v;
}

function timestamps(values: unknown, n: number, name: string, regular = false): number[] {
  requireValue(Array.isArray(values) && values.length === n, 'TIME', `${name} must match observation count`);
  const result: number[] = [];
  for (const value of values) {
    requireValue(typeof value === 'string' && /^\d{4}-\d{2}-\d{2}T\d{2}:\d{2}:\d{2}(?:\.\d{3})?Z$/.test(value), 'TIME', 'use UTC ISO timestamps');
    const instant = Date.parse(value);
    const canonical = value.length === 20 ? value.replace('Z', '.000Z') : value;
    requireValue(Number.isFinite(instant) && Number(value.slice(0, 4)) >= 1000 && new Date(instant).toISOString() === canonical, 'TIME', 'invalid calendar timestamp');
    requireValue(!result.length || instant > result[result.length - 1], 'TIME', 'timestamps must strictly increase');
    result.push(instant);
  }
  if (regular && n > 2) requireValue(result.slice(2).every((v, i) => v - result[i + 1] === result[1] - result[0]), 'ALIGNMENT', 'returns need a regular grid');
  return result;
}

function bars(data: RecordValue): any[][] {
  const values = data.bars;
  requireValue(Array.isArray(values) && values.length >= 2 && values.every(b => b && typeof b === 'object' && !Array.isArray(b)), 'SHAPE', 'bars needs at least two OHLC objects');
  timestamps(values.map(b => b.timestamp), values.length, 'bars.timestamp');
  return values.map(b => {
    const [o, h, l, c] = ['open', 'high', 'low', 'close'].map(k => finite(b[k], k));
    requireValue(Math.min(o, h, l, c) > 0 && h >= Math.max(o, c) && l <= Math.min(o, c), 'OHLC', 'positive bracketed OHLC required');
    return [b.timestamp, o, h, l, c];
  });
}

function variance(x: number[]): number {
  const mean = sum(x) / x.length;
  return sum(x.map(v => (v - mean) ** 2)) / (x.length - 1);
}

function seriesResult(series: (RecordValue | null)[], diagnostics: RecordValue): RecordValue {
  const at = series.findIndex(v => v !== null);
  return {series, latest: series.at(-1) ?? null, ready: series.length > 0 && series.at(-1) !== null,
    ready_at: at < 0 ? null : at, diagnostics};
}

function historical(data: RecordValue, p: RecordValue, kind: string): RecordValue {
  const values = bars(data), w = integer(option(p, 'window', 12), 'window', 2), scale = positive(p, 'annualization_factor', 252);
  const contributions = values.map(([, o, h, l, c], i) => {
    const rs = Math.log(h / c) * Math.log(h / o) + Math.log(l / c) * Math.log(l / o);
    const choices: RecordValue = {
      close_to_close: i === 0 ? null : Math.log(c / values[i - 1][4]),
      parkinson: Math.log(h / l) ** 2 / (4 * Math.log(2)),
      garman_klass: .5 * Math.log(h / l) ** 2 - (2 * Math.log(2) - 1) * Math.log(c / o) ** 2,
      rogers_satchell: rs,
      yang_zhang: [i === 0 ? null : Math.log(o / values[i - 1][4]), Math.log(c / o), rs],
    };
    return choices[kind];
  });
  const series = values.map((bar, i) => {
    const block = contributions.slice(Math.max(0, i - w + 1), i + 1);
    if (block.length < w || block.some(v => v === null) || (kind === 'yang_zhang' && block[0][0] === null)) return null;
    let estimate: number, components: RecordValue = {};
    if (kind === 'yang_zhang') {
      const overnight = variance(block.map(v => v[0])), intraday = variance(block.map(v => v[1]));
      const rs = sum(block.map(v => v[2])) / w, k = .34 / (1.34 + (w + 1) / (w - 1));
      estimate = scale * (overnight + k * intraday + (1 - k) * rs);
      components = {overnight: scale * overnight, open_close: scale * k * intraday, range: scale * (1 - k) * rs, k};
    } else estimate = scale * (kind === 'close_to_close' ? variance(block) : sum(block) / w);
    requireValue(estimate >= 0, 'NUMERIC', 'negative variance: inspect inputs and precision');
    return {timestamp: bar[0], variance: estimate, volatility: Math.sqrt(estimate), contributions: block, components, window_start: i - w + 1, window_end: i};
  });
  return seriesResult(series, {input_count: values.length, annualization_factor: scale, causal: true});
}
export function calculate(data: RecordValue): RecordValue {
  requireValue(data && typeof data === 'object' && !Array.isArray(data),'SHAPE','input must be an object');
  const p=Object.hasOwn(data,'parameters')?data.parameters:{};
  requireValue(p && typeof p === 'object' && !Array.isArray(p),'SHAPE','parameters must be an object');
  const result=historical(data,p,"rogers_satchell");
  function check(v:any):void {
    if(typeof v==='number')requireValue(Number.isFinite(v),'NUMERIC','nonfinite computed output');
    else if(Array.isArray(v))v.forEach(check);
    else if(v && typeof v==='object')Object.values(v).forEach(check);
  }
  check(result);
  return {topic_id:"D10-F01-A04",title:"Rogers-Satchell Volatility",parameters:p,...result};
}
The embedded lab now expands to its full document height, keeping the article as the only scroll surface.