
 By Islam Baraka
The governed definitions this build depends on. Read them first if a term is unfamiliar.
- PrimaryMoney Flow IndexMoney Flow Index is a bounded oscillator that compares positive and negative typical-price money flow.
- PrerequisiteRelative Strength IndexRelative Strength Index is a zero-to-100 oscillator derived from Wilder-smoothed positive gains and loss magnitudes.
- PrerequisiteTrading VolumeTrading volume is the aggregate eligible quantity executed over a stated instrument, source, and interval.
- PrerequisiteTypical PriceTypical Price is the arithmetic average of a bar's high, low, and close prices.
- ImportantMFI Bounded TransformThe MFI bounded transform maps the money-flow ratio to a 0-to-100 oscillator.
- ImportantMFI Money-Flow RatioMFI money-flow ratio compares summed positive flow with summed negative flow.
- ImportantMFI Typical PriceMFI typical price is the average of a bar's high, low, and close.
- ImportantMFI Typical-Price DirectionMFI typical-price direction is the sign of the current typical price relative to the prior one.
- ImportantMFI Warm-Up WindowMFI warm-up window is the history required to classify the first complete set of flows.
- ImportantMFI Zero-Flow Neutral StateMFI zero-flow neutral state is the declared result when both rolling flow sums are zero.
- ImportantNegative Money FlowNegative money flow is raw money flow classified to bars whose typical price fell.
- ImportantPositive Money FlowPositive money flow is raw money flow classified to bars whose typical price rose.
- ImportantRaw Money FlowRaw money flow is typical price multiplied by volume.
Catalog: D07-F05-A04 · Family: D07-F05 Volume Indicators · Status: publication-ready
Start with the decision, not the line
The engineering question is precise: How does price-weighted volume on rising typical-price observations compare with price-weighted volume on falling observations? The learner outcome is equally concrete: Classify price-weighted volume into positive and negative flows, reproduce the 0-to-100 ratio, and understand why a 14-period MFI needs 15 typical prices.
That boundary matters because a chart line is only the last stage of a data contract. MFI sees typical-price direction, typical-price level, current volume, and the selected flow window. It does not see close-only direction, intrabar trade ordering, direct cash transfer, and equal typical-price rows under this package's tie policy. A plausible interpretation that depends on an ignored field is not an insight from this indicator; it is a new rule that must be specified and tested separately.
The market-data identity comes first
“Volume” is not one universal unit. U.S. listed-equity consolidated reporting can combine transactions from multiple market centers; a venue-only feed is a different population. Futures volume counts contracts for a specific contract, which raises a separate continuous-series and roll question. Other datasets may expose base-asset units, quote-asset notional, trade counts, or tick volume. None can be exchanged silently.
The close also needs a clock. A regular-session official close, a last consolidated trade, and an after-hours last trade can differ. When the formula compares closes, classifies typical-price direction, or locates the close inside a bar, that upstream choice can change the result even when the numeric kernel is flawless.
Production output should therefore travel with instrument identifier, venue or consolidated scope, volume unit, bar interval, session and close policy, time zone, correction state, corporate-action basis, parameters, history start, seed, and code version. The synthetic fixture deliberately claims none of those market identities.
The question this indicator actually answers
Technical indicators become dangerous when a familiar label replaces a precise question. MFI is useful because it compresses a defined recent path, but its output only means what its inputs, windows, and initialization allow it to mean.
Multiply typical price by volume, classify each raw flow by the direction of typical-price change, then compare trailing positive and negative sums. MFI is a bounded directional ratio of price-weighted volume. It is not cash flow, and its common 20/80 zones are descriptive conventions. That sentence is the center of the tutorial: measurement first, interpretation second, trading rules elsewhere.
Freeze the data before the formula
The selected input is finalized high, low, close, and nonnegative volume. Bars must be strictly ordered and finalized, use one interval and session policy, and share one documented price/volume adjustment basis. If a split is handled in close but not high and low, a range indicator can become mathematically correct over economically inconsistent fields. If a missing bar is silently filled, the lookback describes a different time path. The reference function therefore validates numeric structure and leaves timestamps, calendars, adjustments, and finality to the caller.
The canonical fixture contains 120 author-generated UTC daily bars. It is intentionally synthetic. It can prove arithmetic, warm-up, parity, and causal behavior; it cannot prove a market edge.
The selected calculation
| Symbol | Meaning | Unit / scale |
|---|---|---|
| TPₜ | (High + Low + Close) / 3 | price units |
| RMFₜ | Typical price multiplied by volume | price × volume |
| PMF / NMF | Trailing positive / negative classified flow | price × volume |
| MFIₜ | 100 × PMF / (PMF + NMF) | 0 to 100 |
Parameters are period=14. Multiply typical price by volume, classify each raw flow by the direction of typical-price change, then compare trailing positive and negative sums. The first ready point is index 14 because 14 classified flows require 15 typical prices. Every earlier row remains visibly unavailable rather than being replaced by zero. Zero is a valid indicator value for some indicators, so using it as a warm-up sentinel would corrupt both charts and downstream rules.
Read the scale carefully
MFI is a bounded directional ratio of price-weighted volume. It is not cash flow, and its common 20/80 zones are descriptive conventions. Positive-only flow returns 100, negative-only returns 0, and a complete window with both sums zero returns the selected neutral value 50. A threshold can be a convenient classification boundary, but it is not a probability calibration. A reading in a commonly named zone does not specify an entry time, order type, holding period, stop, cost model, or expected return.
The variant trap
Equal typical prices may be ignored or assigned differently across platforms. This package assigns equal rows to neither side and returns 50 when both sums are zero. When two platforms disagree, compare instrument and venue scope, volume unit, session close, source fields, parameters, scale, seed or EMA initialization, warm-up, equality policy, and zero behavior before assuming either is broken. Matching the indicator name is not enough.
Reproduce one complete row
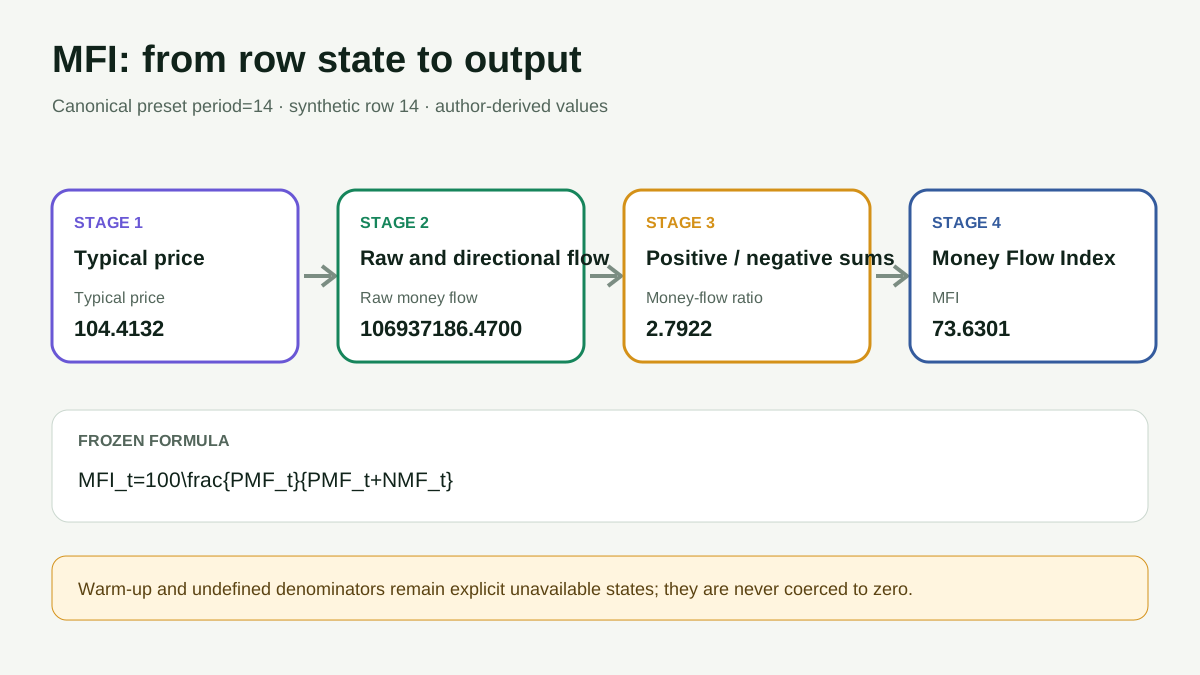
The independently audited canonical row is zero-based index 14 (2025-01-15T00:00:00Z, synthetic). No value below is a provider observation.
| Component | Author-derived value |
|---|---|
| Typical price | 104.41318300 |
| Raw money flow | 106937186.47003837 |
| Positive-flow sum | 1097811157.39585209 |
| Negative-flow sum | 393169896.48760098 |
| Money-flow ratio | 2.79220553 |
| MFI | 73.63012122 |
Independent substitution: 100 × 1097811157.39585209 / (1097811157.39585209 + 393169896.48760098) = 73.63012122.
Published checkpoints round to 10 decimal places; teaching prose shows 8 decimals.
Compare six complete paths
| Scenario | Ready rows | Undefined rows | Final output | Teaching purpose |
|---|---|---|---|---|
| Canonical · four regimes | 106 | 0 | 37.6591 | Four deterministic price regimes with changing participation and three controlled volume shocks. |
| Comparison · rise with expanding volume | 106 | 0 | 100.0000 | A persistent rise with expanding activity separates full-volume signs from return- and range-weighted contributions. |
| Comparison · range cycle | 106 | 0 | 47.7836 | A bounded price cycle with varying activity exposes repeated positive and negative volume contributions. |
| Boundary · flat, zero volume, then shock | 106 | 0 | 100.0000 | A flat zero-range and zero-volume prefix exposes neutral, unchanged, warm-up, and undefined states before a controlled shock. |
| Diagnostic · gap versus close location | 106 | 0 | 70.8559 | Alternating gaps deliberately close near the opposite edge of each bar, separating close-to-close indicators from Chaikin close-location indicators. |
| Diagnostic · activity shock without price movement | 106 | 0 | 39.7427 | Extreme-volume equal-close and zero-range bars expose which formulas contribute zero, dilute a denominator, return neutral, or retain recursive state. |
These scenarios are not cherry-picked trades. They isolate mechanics: multi-regime behavior, persistent direction, repeated range movement, and a zero-movement boundary followed by a controlled shock. Python and TypeScript consume the same canonical JSON checkpoints, while the playground exposes the enriched component trace for all scenario/preset combinations.
Why this indicator disagrees with Relative Strength Index and Chaikin Money Flow
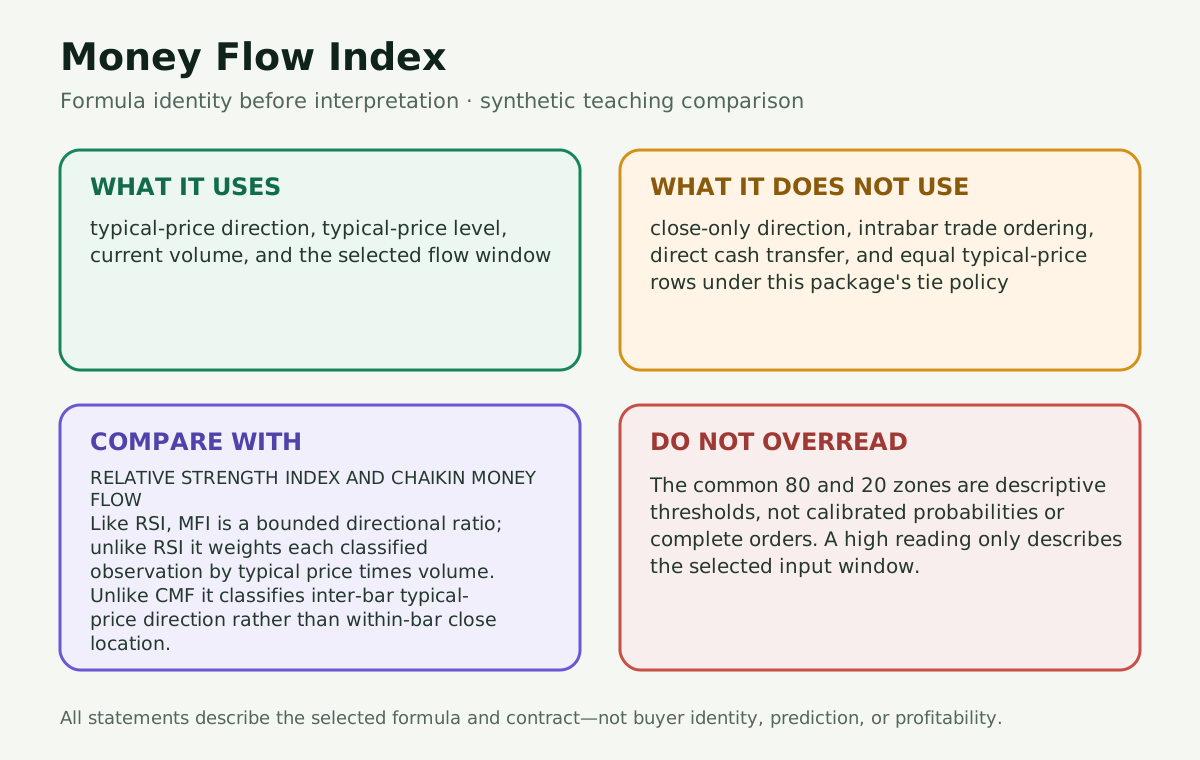
Like RSI, MFI is a bounded directional ratio; unlike RSI it weights each classified observation by typical price times volume. Unlike CMF it classifies inter-bar typical-price direction rather than within-bar close location. This is not a minor display difference. It changes which observations receive weight and therefore which path can move the output.
The shared gap versus close location scenario makes the distinction observable. Alternating gaps deliberately close near the opposite edge of each bar. The shared activity shock without price movement scenario inserts extreme volume on equal-close, zero-range rows. For this topic, the expected takeaway is: The activity-shock scenario separates a complete zero-flow window returning 50 from CMF's undefined zero-volume denominator.
Open the comparison at full size
Reconcile another implementation in this order
- Confirm the exact formula name; “A/D,” “money flow,” and “Force Index” can refer to nearby but different methods.
- Compare ordered raw inputs—not screenshots—including instrument, venue scope, volume unit, interval, session, correction version, and price/volume adjustment basis.
- Freeze parameters, scale, tie policy, zero-range or zero-denominator policy, seed, EMA initialization, first-ready index, and rounding.
- Compare intermediate components at the first disagreement. A final-line mismatch is only a symptom.
- Test one equality row, one zero-volume row, one large gap, and one revision. These cases identify conventions faster than a long ordinary history.
Four conventions must match: period, typical-price formula, equal-price classification, and all-zero-flow behavior. This package ignores ties and returns neutral 50 when both complete-window sums are zero.
Revisions and causal recomputation
A revised OHLC row changes its typical price and can reclassify flows at that row and the following row. Recompute rolling outputs whose n-flow window contains either affected classification.
This is a causal statement, not merely a performance optimization. Recompute too little and stale values survive; recompute the entire history unnecessarily and an operational pipeline becomes expensive without gaining correctness. Store the earliest affected observation and the algorithm's dependency horizon beside revision jobs.
See the component pipeline
What to notice: each box names a state that is visible in the playground audit table. If the final output is unavailable, the status panel identifies whether the missing stage is causal warm-up or an undefined denominator.
Open the component pipeline at full size.
Implementation and operational behavior
The reference code favors transparency and aligned nulls. The enriched fixture adds author-derived component traces without changing the reference function's public calculation. The executable examples print audited ready rows. The reference implementation is O(n): cumulative and recursive stages update once per row, while CMF and MFI use causal running sums. A streaming version must preserve the same clock, components, seed or window state, aligned nulls, and invalid-state semantics.
Revision policy matters. Rolling indicators require recalculation until the revised row leaves the largest window. Recursive indicators can alter the entire suffix. Store the code version and parameters with the published series.
What can go wrong
Do not use close direction instead of typical-price direction, double-count equal rows, or interpret 80/20 as a calibrated return probability. Also avoid hindsight-defined divergence, thresholds optimized on the evaluation sample, and provisional-bar signals evaluated against finalized-bar outcomes. These are research-design failures, not formula failures.
Combining several volume indicators does not automatically create independent evidence. OBV, VPT, A/D, CMF, MFI, and Force Index reuse overlapping price-volume information. Correlated transforms may create a false impression of confirmation.
Appropriate real-world use
Use MFI as a reproducible chart layer, a monitored feature, or one input to a separately governed research pipeline. Define any event rule after the measurement: crossing direction, tolerance, bar finality, action time, costs, and risk controls all belong outside the indicator.
Why the historical example is deferred
A named security would require authoritative or licensed timestamped observations, stable identifier, time zone and session semantics, adjusted-or-unadjusted basis, corporate-action and correction lineage, access date, and redistribution rights. It would also require a clean separation between provider observations and author-derived values. Until that evidence bundle exists, a named example would add realism at the cost of provenance. The synthetic case is the stronger verification artifact today.
Takeaway
MFI is best understood as a contract: declared data, declared transformation, declared warm-up, and declared limits. Preserve that contract and the output is reproducible. Add trading meaning without a separate rule and evidence process, and precision turns into false confidence.
Sources
See ../REFERENCES.md for the claim-level source ledger and limits.
Rendered from the canonical Mermaid sources linked by this article.
Calculation flow
Purpose: expose the exact dependency that is warming up or undefined before MFI is emitted.
Interpretation: a null result is not enough information by itself. The enriched fixture and lab preserve the component trace plus a reason that distinguishes causal warm-up from an undefined scale.
Takeaway: availability gates are part of the algorithm, not presentation cleanup.
Data-basis reconciliation — Money Flow Index
Use this decision flow before comparing two implementations or provider displays.
Takeaway: Four conventions must match: period, typical-price formula, equal-price classification, and all-zero-flow behavior. This package ignores ties and returns neutral 50 when both complete-window sums are zero. Final values come last; the first mismatched input or component explains the disagreement.
ReferencesPrimary sources and evidence notesExpand the source trail, evidence role, and limitations behind the engineering choices.
Expand the source trail, evidence role, and limitations behind the engineering choices.
Money Flow (MFI)
- Organization or authors: TradingView
- Source type: Official product or maintained technical documentation
- Publication or effective date: Current documentation at access
- Version: Web documentation accessed 2026-07-26
- URL: Money Flow (MFI)
- Accessed: 2026-07-26
- Jurisdiction: Platform convention; not jurisdiction-specific
- Applicability: Used only within the scope recorded for Money Flow (MFI); it does not override this package's explicit implementation and market-data conventions.
- Supports: Typical price, raw money flow, positive/negative classification, money-flow ratio, 0-to-100 formula, and Quong/Soudack attribution.
- Limitations: Equal-typical-price and all-zero-flow behavior are package-selected and stated separately.
Volume
- Organization or authors: TradingView
- Source type: Official product or maintained technical documentation
- Publication or effective date: Current documentation at access
- Version: Web documentation accessed 2026-07-26
- URL: Volume
- Accessed: 2026-07-26
- Jurisdiction: Platform convention; not jurisdiction-specific
- Applicability: Used only within the scope recorded for Volume; it does not override this package's explicit implementation and market-data conventions.
- Supports: Volume is instrument-specific: shares for stocks and contracts for futures or options.
- Limitations: The page explains charting semantics, not exchange reporting, correction, or licensing rules.
TA-Lib function API and volume indicators
- Organization or authors: TA-Lib
- Source type: Maintained official technical documentation
- Publication or effective date: Current documentation at access
- Version: Web documentation accessed 2026-07-26
- URL: TA-Lib function API and volume indicators
- Accessed: 2026-07-26
- Jurisdiction: Platform convention; not jurisdiction-specific
- Applicability: Used only within the scope recorded for TA-Lib function API and volume indicators; it does not override this package's explicit implementation and market-data conventions.
- Supports: Maintained function identities for Chaikin A/D, OBV, and the related TA-Lib volume-indicator group.
- Limitations: The function list does not establish this package's seed, null, tie, precision, or error conventions; byte-for-byte TA-Lib parity is not claimed.
Consolidated Tape
- Organization or authors: U.S. Securities and Exchange Commission, Investor.gov
- Source type: Regulator investor-education glossary
- Publication or effective date: Current documentation at access
- Version: Web documentation accessed 2026-07-26
- URL: Consolidated Tape
- Accessed: 2026-07-26
- Jurisdiction: United States listed equities
- Applicability: Used only within the scope recorded for Consolidated Tape; it does not override this package's explicit implementation and market-data conventions.
- Supports: For U.S. exchange-listed stocks, consolidated price and volume reports combine transactions from multiple market centers, including exchanges and off-exchange venues.
- Limitations: This glossary definition does not prescribe a universal bar-building, correction, licensing, or international-market policy.
Closing Price
- Organization or authors: U.S. Securities and Exchange Commission, Investor.gov
- Source type: Regulator investor-education glossary
- Publication or effective date: Current documentation at access
- Version: Web documentation accessed 2026-07-26
- URL: Closing Price
- Accessed: 2026-07-26
- Jurisdiction: United States equities
- Applicability: Used only within the scope recorded for Closing Price; it does not override this package's explicit implementation and market-data conventions.
- Supports: Regular-session and after-hours closing-price conventions can differ across published sources, so the close field and session boundary must be declared.
- Limitations: The page describes U.S. equity conventions; other jurisdictions, instruments, and providers can use different sessions and official closes.
What is Volume?
- Organization or authors: CME Group
- Source type: Official exchange education
- Publication or effective date: Current documentation at access
- Version: Web documentation accessed 2026-07-26
- URL: What is Volume?
- Accessed: 2026-07-26
- Jurisdiction: Exchange-traded futures
- Applicability: Used only within the scope recorded for What is Volume?; it does not override this package's explicit implementation and market-data conventions.
- Supports: Futures volume counts contracts traded over the selected interval and is reported by contract.
- Limitations: This is futures-specific education and does not define equity shares, options multipliers, spot-FX tick volume, crypto venue scope, or continuous-contract roll construction.
TA-Lib momentum indicator functions
- Organization or authors: TA-Lib
- Source type: Maintained official technical documentation
- Publication or effective date: Current documentation at access
- Version: Web documentation accessed 2026-07-26
- URL: TA-Lib momentum indicator functions
- Accessed: 2026-07-26
- Jurisdiction: Platform convention; not jurisdiction-specific
- Applicability: Used only within the scope recorded for TA-Lib momentum indicator functions; it does not override this package's explicit implementation and market-data conventions.
- Supports: The maintained MFI function identity and common 14-period API default.
- Limitations: The page labels MFI as having an unstable period but does not define this package's equal-price or all-zero-flow policy.
Claim-role ledger
| Role | Material content in this package | Treatment |
|---|---|---|
| Sourced fact | Indicator attribution, original-book identity, and maintained function/reference implementation identity | Supported only to the limits recorded above |
| Implementation choice | Parameters, seed, warm-up suppression, null behavior, tie handling, and displayed scale | Frozen in the canonical README and contract; never attributed universally |
| Synthetic teaching input | Four deterministic 120-row OHLCV scenarios | Labeled synthetic in datasets, examples, visuals, and playground |
| Author-derived calculation | Component traces, checkpoints, classifications, diagrams, and worked substitutions | Reproducible from the published formula and fixture; not provider data |
| Empirical result | None | No association, prediction, profitability, or strategy-performance claim is published |
Evidence boundary
The scenarios are author-generated synthetic teaching data. Formulas, outputs, component traces, checkpoints, diagrams, and interpretations derived from them are author calculations. No fixture row is a provider observation, no threshold is presented as a probability, and no trading-performance claim is made.
A historical example is deferred. Publication would require a traceable instrument identifier, licensed or authoritative timestamped OHLCV data, session/time-zone rules, adjusted-or-unadjusted basis, corporate-action lineage, exact parameters and seeds, access date, and reproducible provider-versus-author calculation separation.
Enhanced claim-to-source map
| Claim | Role | Evidence treatment |
|---|---|---|
| Canonical formula identity | Sourced fact plus package convention | Indicator-specific maintained documentation supports the named components; this package freezes seed, null, tie, scale, and warm-up behavior |
| U.S. consolidated equity scope | Sourced fact | Investor.gov supports multi-market-center consolidated reporting; no universal or international scope is inferred |
| Regular-session versus after-hours close | Sourced fact | Investor.gov supports the existence of differing published close conventions; the caller must select one |
| Futures volume counts contracts | Sourced fact | CME Group supports the futures-specific unit; it is not generalized to shares, ticks, or notional |
| MFI checkpoints and scenarios | Author-derived calculation | Reproduced from labeled synthetic OHLCV, formula components, and declared rounding |
| The common 80 and 20 zones are descriptive thresholds, not calibrated probabilities or complete orders. A high reading only describes the selected input window. | Formula analysis / implementation boundary | Follows from the variables absent from the selected formula; it is not an empirical performance result |
Public evidence boundary
No provider payload or named market observation is republished. Platform pages support formula identity and documented conventions, not profitability, causal order flow, or universal predictive value. Historical publication remains deferred until identity, market-data scope, session, corrections, adjustment lineage, parameters, access time, and rights are reproducible.
Full dependency-light reference implementations in both supported languages.
function period(value:number,name:string){if(!Number.isInteger(value)||value<=0)throw new Error(`${name} must be a positive integer`)}
function series(values:number[],name:string,nonnegative=false,positive=false){if(!Array.isArray(values)||values.length===0)throw new Error(`${name} must be non-empty`);return values.map(value=>{if(!Number.isFinite(value))throw new Error(`${name} must be finite`);if(nonnegative&&value<0)throw new Error(`${name} must be nonnegative`);if(positive&&value<=0)throw new Error(`${name} must be strictly positive`);return Number(value)})}
function aligned(...items:number[][]){if(new Set(items.map(x=>x.length)).size!==1)throw new Error("input series must align")}
function ohlcv(high:number[],low:number[],close:number[],volume:number[]){high=series(high,"high");low=series(low,"low");close=series(close,"close");volume=series(volume,"volume",true);aligned(high,low,close,volume);for(let i=0;i<close.length;i++)if(low[i]>high[i]||close[i]<low[i]||close[i]>high[i])throw new Error("require low <= close <= high");return{high,low,close,volume}}
function moneyFlow(high:number[],low:number[],close:number[],volume:number[]){const x=ohlcv(high,low,close,volume),multiplier:number[]=[],mfv:number[]=[];for(let i=0;i<x.close.length;i++){const span=x.high[i]-x.low[i],m=span===0?0:((x.close[i]-x.low[i])-(x.high[i]-x.close[i]))/span;multiplier.push(m);mfv.push(m*x.volume[i])}return{...x,multiplier,mfv}}
export function obv(close:number[],volume:number[],initial=0){close=series(close,"close");volume=series(volume,"volume",true);aligned(close,volume);if(!Number.isFinite(initial))throw new Error("initial must be finite");const direction=Array(close.length).fill(0),signed_volume=Array(close.length).fill(0),values=Array(close.length).fill(initial);for(let i=1;i<close.length;i++){direction[i]=close[i]>close[i-1]?1:close[i]<close[i-1]?-1:0;signed_volume[i]=direction[i]*volume[i];values[i]=values[i-1]+signed_volume[i]}return{direction,volume,signed_volume,obv:values}}
export function accumulationDistributionLine(high:number[],low:number[],close:number[],volume:number[],initial=0){const x=moneyFlow(high,low,close,volume);if(!Number.isFinite(initial))throw new Error("initial must be finite");let running=initial;const adl=x.mfv.map(value=>(running+=value));return{range:x.high.map((h,i)=>h-x.low[i]),money_flow_multiplier:x.multiplier,volume:x.volume,money_flow_volume:x.mfv,adl}}
export function chaikinMoneyFlow(high:number[],low:number[],close:number[],volume:number[],p=20){period(p,"period");const x=moneyFlow(high,low,close,volume),rolling_mfv:(number|null)[]=Array(x.close.length).fill(null),rolling_volume:(number|null)[]=Array(x.close.length).fill(null),cmf:(number|null)[]=Array(x.close.length).fill(null);let numerator=0,denominator=0;for(let i=0;i<x.close.length;i++){numerator+=x.mfv[i];denominator+=x.volume[i];if(i>=p){numerator-=x.mfv[i-p];denominator-=x.volume[i-p]}if(i>=p-1){rolling_mfv[i]=numerator;rolling_volume[i]=denominator;if(denominator!==0)cmf[i]=numerator/denominator}}return{money_flow_multiplier:x.multiplier,money_flow_volume:x.mfv,rolling_mfv,rolling_volume,cmf}}
export function moneyFlowIndex(high:number[],low:number[],close:number[],volume:number[],p=14){period(p,"period");const x=ohlcv(high,low,close,volume),typical_price=x.close.map((c,i)=>(x.high[i]+x.low[i]+c)/3),raw_money_flow=typical_price.map((v,i)=>v*x.volume[i]),positive=Array(x.close.length).fill(0),negative=Array(x.close.length).fill(0);for(let i=1;i<x.close.length;i++){if(typical_price[i]>typical_price[i-1])positive[i]=raw_money_flow[i];else if(typical_price[i]<typical_price[i-1])negative[i]=raw_money_flow[i]}const positive_flow:(number|null)[]=Array(x.close.length).fill(null),negative_flow:(number|null)[]=Array(x.close.length).fill(null),money_flow_ratio:(number|null)[]=Array(x.close.length).fill(null),mfi:(number|null)[]=Array(x.close.length).fill(null);let ps=0,ns=0;for(let i=0;i<x.close.length;i++){ps+=positive[i];ns+=negative[i];if(i>=p){ps=Math.max(0,ps-positive[i-p]);ns=Math.max(0,ns-negative[i-p])}if(i<p)continue;positive_flow[i]=ps;negative_flow[i]=ns;if(ps===0&&ns===0){money_flow_ratio[i]=1;mfi[i]=50}else if(ns===0){money_flow_ratio[i]=null;mfi[i]=100}else if(ps===0){money_flow_ratio[i]=0;mfi[i]=0}else{money_flow_ratio[i]=ps/ns;mfi[i]=100*ps/(ps+ns)}}return{typical_price,raw_money_flow,positive_flow,negative_flow,money_flow_ratio,mfi}}
export function volumePriceTrend(close:number[],volume:number[],initial=0){close=series(close,"close",false,true);volume=series(volume,"volume",true);aligned(close,volume);if(!Number.isFinite(initial))throw new Error("initial must be finite");const price_return=Array(close.length).fill(0),volume_contribution=Array(close.length).fill(0),vpt=Array(close.length).fill(initial);for(let i=1;i<close.length;i++){price_return[i]=(close[i]-close[i-1])/close[i-1];volume_contribution[i]=price_return[i]*volume[i];vpt[i]=vpt[i-1]+volume_contribution[i]}return{price_return,volume,volume_contribution,vpt}}
export function forceIndex(close:number[],volume:number[],p=13){period(p,"period");close=series(close,"close");volume=series(volume,"volume",true);aligned(close,volume);const change:(number|null)[]=[null,...close.slice(1).map((v,i)=>v-close[i])],raw_force:(number|null)[]=[null,...close.slice(1).map((_,i)=>(change[i+1] as number)*volume[i+1])],ema_seed:(number|null)[]=Array(close.length).fill(null),output:(number|null)[]=Array(close.length).fill(null);if(close.length>p){let value=(raw_force.slice(1,p+1) as number[]).reduce((a,b)=>a+b,0)/p;ema_seed[p]=value;output[p]=value;const alpha=2/(p+1);for(let i=p+1;i<close.length;i++){value=alpha*(raw_force[i] as number)+(1-alpha)*value;output[i]=value}}return{change,volume,raw_force,ema_seed,force_index:output}}
The embedded lab now expands to its full document height, keeping the article as the only scroll surface.