
 By Islam Baraka
The governed definitions this build depends on. Read them first if a term is unfamiliar.
- Primary20-Day Breadth20-Day Breadth is percent-above-moving-average breadth calculated with a 20-session moving average.
- PrerequisiteMoving-Average LookbackMoving-Average Lookback is the declared window length and calendar basis used by a moving-average calculation.
- PrerequisitePrice Above Moving AveragePrice Above Moving Average is a Boolean classification that is true when the selected price exceeds its specified moving average.
- PrerequisiteSimple Moving AverageSimple Moving Average is the arithmetic mean of observations in a declared moving window.
- ImportantEligible Moving-Average PopulationEligible Moving-Average Population is the point-in-time set of securities with valid membership, price, and sufficient history for a moving-average comparison.
- ImportantPercent Above Moving AveragePercent Above Moving Average is the percentage of eligible securities whose selected price is above the selected moving average.
- ImportantPrice Below Moving AveragePrice Below Moving Average is a Boolean classification that is true when the selected price is below its specified moving average.
- ImportantTrend ParticipationTrend Participation describes how widely a directional trend is shared across an eligible security universe.
An index level can look healthy while participation underneath it is narrow. Percent Above 20-Day MA makes one precise internal question auditable: How much of the point-in-time universe is above its own short moving baseline right now? The output is descriptive evidence, not a forecast or trading instruction.
The decision this measure owns
Choose 20 sessions when responsiveness is the goal and frequent classification changes are an accepted trade-off.
The family contains nearby measures because “breadth” is not one calculation. A raw difference, a ratio, a bounded smoother, and three moving-average horizons can all be correct while answering different questions. The implementation must name the universe, session, method, and knowledge cutoff before it publishes any of them.
Freeze the evidence before the formula
Use stable security identifiers and membership effective for the evaluated session. Record both effective_at and available_at: the first says when the market state applies; the second says when a system could know it. A correction received tomorrow cannot enter today's decision retroactively.
StockCharts' provider-method explanation describes the general count-over-universe construction. The package selects a strict SMA comparison, adjusted-close basis, and atomic denominator as explicit implementation choices. The Nasdaq corporate-actions manual supports the narrower point that adjustment handling is methodology- and effective-date-sensitive.
Every number in this tutorial is labelled synthetic. No provider observation is republished.
Formula and unit
The output unit is percent of eligible issues. Calculate at full precision and round only for display. Keep the diagnostics that explain the result—counts, denominator, window, comparison flags, status, reason, and series identity.
Work the canonical state
For each point-in-time member, compute one arithmetic SMA20 from exactly 20 comparable adjusted closes. Compare the current adjusted close strictly with that mean. Count above = true, retain every ready member in the denominator, and then calculate the percentage.
The canonical cross-section has 24 members: 15 above, 8 below, and 1 exactly equal. The strict rule gives 100 × 15 / 24 = 62.5%. Security T24 is the equality control: current price 100 and SMA 100. It remains eligible but contributes zero to the numerator.
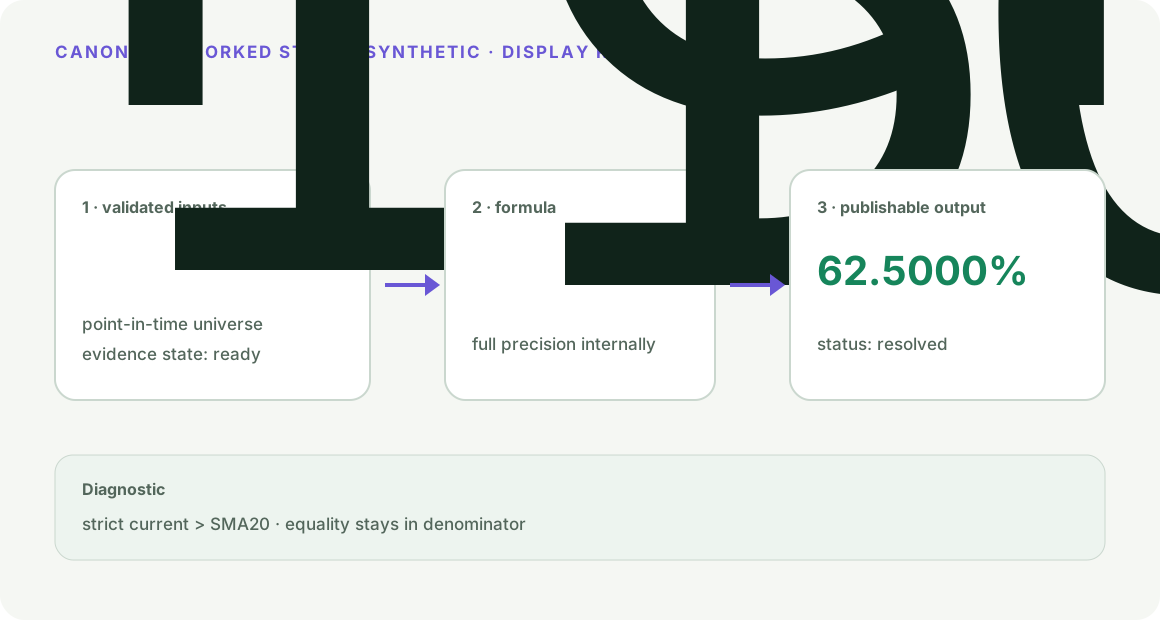
The first visual preserves the existing parity fixture. It separates ready inputs, author-derived arithmetic, and the display-rounded output.
Inspect the decision boundary
Equality is not above. An unresolved member does not disappear from the denominator; the full aggregate is withheld until its evidence is ready.
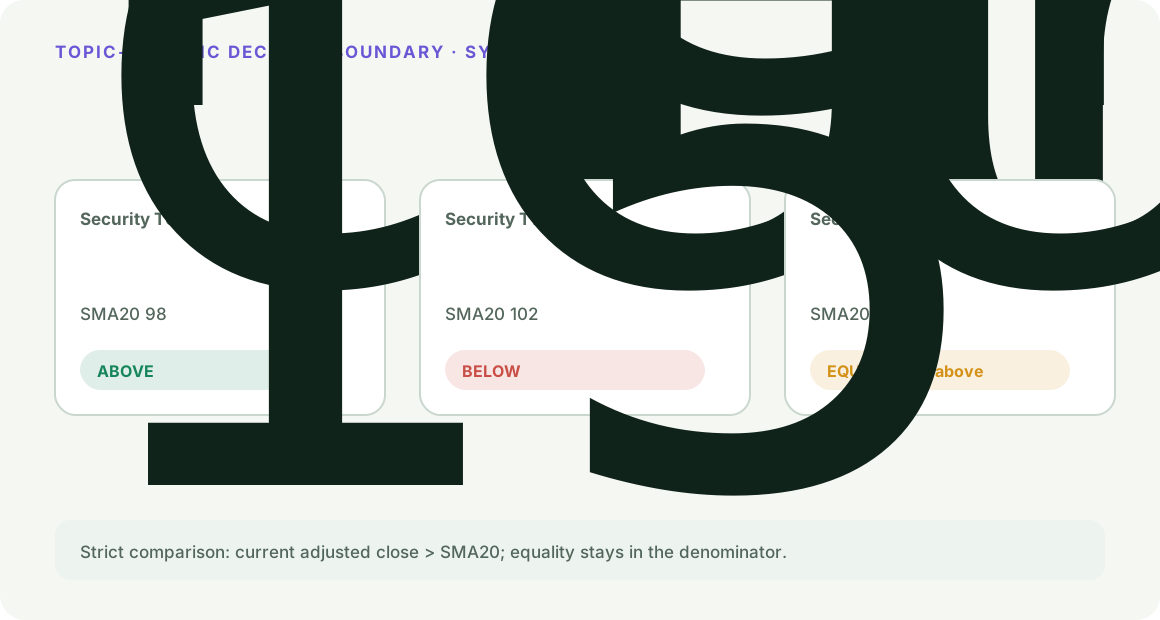
The second visual makes the non-obvious branch visible. It is deliberately synthetic, so the learner can inspect the state without mistaking it for a historical market claim.
Follow the algorithm's branch
The formula runs only after identity, causal availability, and completeness checks pass. An incomplete, warming, unbounded, or unsupported result is part of the algorithm—not an exception to hide in a log.
Reference implementation
The Python and TypeScript modules use the same fixture and return the same value, null state, reason code, and diagnostics. Their order is intentional:
- validate session, identifiers, method, and causal cutoff;
- validate the topic-specific count or price-window contract;
- compute the smallest readable transform;
- publish value and evidence state together.
The implementations are dependency-free. The official pandas rolling-mean documentation is recorded only for standard rolling terminology where relevant; the code does not delegate correctness to pandas.
Run the signature experiment
Open visuals/animated/playground.html. The signature demonstration is: Rebound switch: lift every current price by two points and show the 20-session count respond before the 50- and 200-session counts.
Use Step and Back to inspect one transition, then Play/Pause to follow the same transition function. Switch to the comparison scenario and read the diagnostic, not just the line. Finally choose the failure scenario and confirm that Reset restores the canonical state. Reduced-motion Play advances one deterministic step without starting a timer.
Compare the sibling, not just the number
After a short rebound, many securities can clear SMA20 while remaining below SMA50 or SMA200. That is memory, not a contradiction.
That comparison is the purpose of the family map:
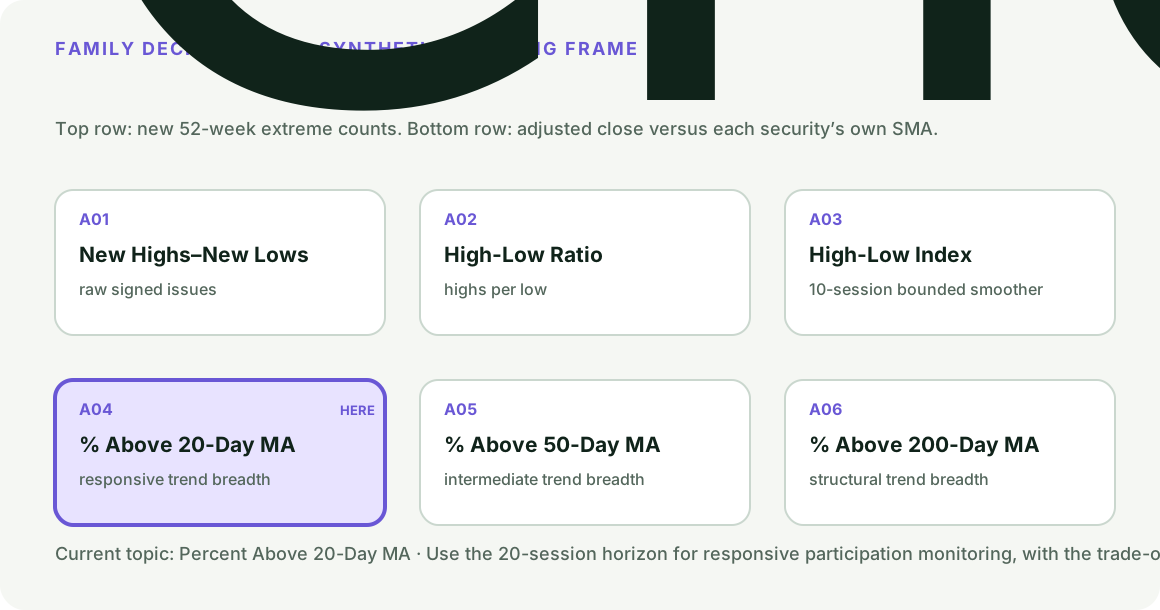
Use the map to choose an input object first—new-extreme events or price relative to a moving baseline—then choose transform and memory. Do not select a measure merely because a charting platform exposes it.
Failure and misuse boundaries
- Never backfill today's roster into an older session.
- Never combine provider totals whose security types, sessions, intervals, equality rules, or adjustments differ.
- Never turn absent or future evidence into zero.
- Never infer predictive power, causation, or profitability from implementation correctness.
- Never hide a changed denominator behind a plausible percentage.
For this topic, the decisive rule is: Equality is not above. An unresolved member does not disappear from the denominator; the full aggregate is withheld until its evidence is ready.
Historical-example decision
The decision remains deferred. A named reconstruction would require point-in-time membership, stable security identity, exact methodology, adjustment or high/low lineage, availability and correction times, and redistribution rights. A screenshot or current provider symbol cannot establish those facts. The synthetic case teaches the mechanism without manufacturing historical certainty.
What the learner can now audit
You can calculate P20_t = 100 × count(price > SMA20) / eligible, explain its unit, reproduce its canonical value, distinguish its invalid states, and choose it over a sibling for a reason. Review High-Low Index if the immediate input concept is unfamiliar. Continue with Percent Above 50-Day MA to see the next transform or horizon.
Primary and provider-method records, applicability, versions, and limitations are maintained in ../REFERENCES.md.
Rendered from the canonical Mermaid sources linked by this article.
Topic decision flow — Percent Above 20-Day MA
Purpose: expose the branch that is unique to P20_t = 100 × count(price > SMA20) / eligible after identity and availability have passed.
Takeaway: Equality is not above. An unresolved member does not disappear from the denominator; the full aggregate is withheld until its evidence is ready.
ReferencesPrimary sources and evidence notesExpand the source trail, evidence role, and limitations behind the engineering choices.
Expand the source trail, evidence role, and limitations behind the engineering choices.
Access date for web sources: 2026-07-25. Source roles are deliberately limited to the claims each record can support.
STOCKCHARTS-PERCENT — Percent Above Moving Average
- Organization: StockCharts ChartSchool
- Source type: Maintained provider-method documentation
- Publication/effective date: Current documentation
- Version: Web page accessed 2026-07-25
- URL: https://chartschool.stockcharts.com/table-of-contents/market-indicators/percent-above-moving-average
- Accessed: 2026-07-25
- Jurisdiction/applicability: Index-constituent breadth examples
- Supports: The measure divides the number of securities above a specified moving average by the total securities in the declared index and expresses the result as a percentage.
- Limitations: Available provider horizons and interpretive thresholds do not define this package's 20/50/200 SMA choices or promise predictive value.
NASDAQ-CORPORATE-ACTIONS — Corporate Actions and Events Manual, Equities
- Organization: Nasdaq Global Indexes
- Source type: Official methodology manual
- Publication/effective date: 2026-05-20
- Version: 20 May 2026 manual, accessed 2026-07-25
- URL: https://indexes.nasdaq.com/docs/Corporate_Actions_and_Events_Manual_Equities.pdf
- Accessed: 2026-07-25
- Jurisdiction/applicability: Nasdaq equity indexes
- Supports: Corporate-action handling is methodology- and effective-date-sensitive.
- Limitations: This package is not a Nasdaq index implementation; it selects comparable adjusted-close histories for synthetic instruction.
PANDAS-ROLLING — Rolling Mean Documentation
- Organization: pandas project
- Source type: Official maintained software documentation
- Publication/effective date: pandas 3.0.5 documentation
- Version: 3.0.5, accessed 2026-07-25
- URL: https://pandas.pydata.org/docs/reference/api/pandas.api.typing.Rolling.mean.html
- Accessed: 2026-07-25
- Jurisdiction/applicability: Rolling-window software semantics
- Supports: A rolling object can calculate a window mean; the package's arithmetic-mean language is compatible with standard rolling terminology.
- Limitations: The reference implementations are dependency-free and do not call pandas; this source does not define market breadth.
Evidence decision
Historical example: deferred. A named 20-session reconstruction requires point-in-time membership, complete comparable adjusted histories, corporate-action lineage, availability/correction timestamps, stable identifiers, and redistribution rights. The public package uses labelled synthetic teaching data and makes no prediction, causation, threshold-performance, or profitability claim.
Full dependency-light reference implementations in both supported languages.
/** Point-in-time percent-above-moving-average reference implementation. */
export type SecurityWindow = {
  security_id: string;
  member_at_session: boolean;
  source_evidence_state: string;
  available_at: string;
  adjustment_basis: string;
  prices: number[];
};
export type TrendSnapshot = {
  window_sessions: number;
  price_field: string;
  securities: SecurityWindow[];
};

const WINDOW = 20;
const EXPECTED_BASIS = "split-adjusted-price-return";

function time(value: unknown, field: string): number {
  if (typeof value !== "string" || !/(Z|[+-]\d\d:\d\d)$/.test(value)) throw new Error(`${field} must be offset-aware`);
  const parsed = Date.parse(value);
  if (!Number.isFinite(parsed)) throw new Error(`${field} must be a valid timestamp`);
  return parsed;
}

export function evaluateSnapshot(snapshot: TrendSnapshot, decisionTime: string) {
  const cutoff = time(decisionTime, "decision_time");
  if (snapshot.window_sessions !== WINDOW) return {status: "unsupported", reason: "wrong_window", percent_above: null};
  if (snapshot.price_field !== "adjusted_close") return {status: "unsupported", reason: "wrong_price_field", percent_above: null};
  if (!Array.isArray(snapshot.securities) || !snapshot.securities.length) throw new Error("securities must be a non-empty list");
  const seen = new Set<string>();
  const rows: {security_id: string; current_price: number; moving_average: number; above: boolean; equal: boolean}[] = [];
  for (const security of snapshot.securities) {
    if (!security.security_id || seen.has(security.security_id)) throw new Error("security_id values must be unique non-empty strings");
    seen.add(security.security_id);
    if (security.member_at_session !== true) continue;
    if (security.adjustment_basis !== EXPECTED_BASIS) return {status: "unsupported", reason: "mixed_adjustment_basis", percent_above: null};
    if (security.source_evidence_state !== "ready") return {status: "incomplete", reason: "evidence_not_ready", percent_above: null};
    if (time(security.available_at, "available_at") > cutoff) return {status: "incomplete", reason: "future_evidence", percent_above: null};
    if (!Array.isArray(security.prices) || security.prices.length !== WINDOW) return {status: "incomplete", reason: "incomplete_price_window", percent_above: null};
    if (security.prices.some((value) => !Number.isFinite(value) || value <= 0)) throw new Error("prices must be positive finite numbers");
    const moving_average = security.prices.reduce((sum, value) => sum + value, 0) / WINDOW;
    const current = security.prices.at(-1)!;
    rows.push({security_id: security.security_id, current_price: current, moving_average, above: current > moving_average, equal: current === moving_average});
  }
  if (!rows.length) return {status: "incomplete", reason: "empty_eligible_universe", percent_above: null};
  const aboveCount = rows.filter((row) => row.above).length;
  return {status: "resolved", reason: null, window_sessions: WINDOW, eligible_count: rows.length, above_count: aboveCount, equal_count: rows.filter((row) => row.equal).length, percent_above: 100 * aboveCount / rows.length, rows};
}
The embedded lab now expands to its full document height, keeping the article as the only scroll surface.