
 By Islam Baraka
For analysts and developers who know decimal interval returns, regular sampling grids, and variance versus volatility. The goal is to reproduce the mechanism, inspect its failure states, and decide what the output can legitimately tell you—not to fit or endorse a trading strategy.
Covariance begins with a clock. If one return describes 09:30–09:35 and another describes 09:35–09:40, multiplying them does not measure contemporaneous co-movement, even if both occupy row 17 in a spreadsheet.
Realized covariance is a sum of synchronized return products. Here you will calculate a signed example, distinguish covariance from correlation, and see why a rejected alignment is often a better result than a convenient number.
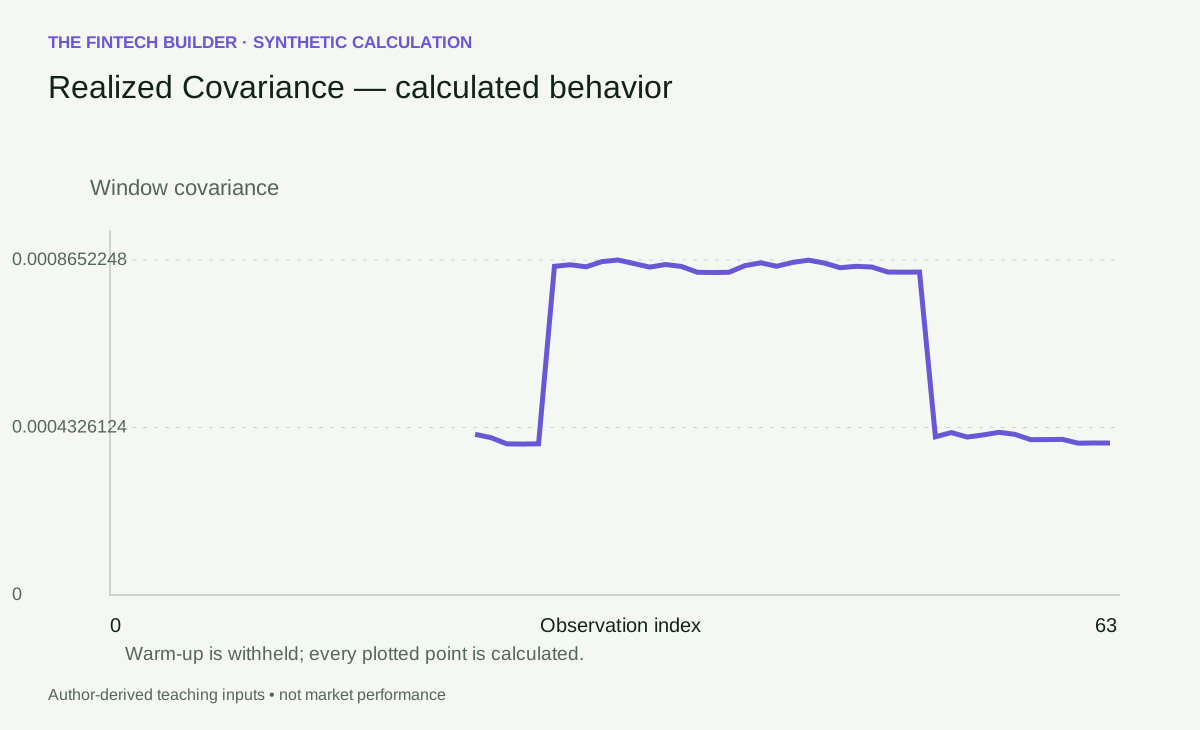
Open this figure at full size.
Pair observations that describe the same interval
For synchronized decimal log returns x_i and y_i, RCov=Σx_i y_i over the declared window. Positive products add same-direction movement; negative products subtract opposite-direction movement. No sample-mean subtraction or n−1 division is applied in this realized-measure convention.
The multivariate realized-covariance framework accumulates outer products of return vectors. The highfrequency estimator documentation distinguishes this family from noise-robust and jump-robust alternatives. This package freezes the simplest exact-grid version; asynchronous sampling estimators are outside its scope.
Timestamp arrays are mandatory here. They must be real, strictly increasing UTC timestamps, equally spaced, equal in length to their respective returns, and identical across assets. They label interval ends; the upstream return construction must also use the same interval starts. Equal end timestamps cannot prove that upstream prices were sampled correctly.
Four products, including cancellation
Use synthetic returns x=[0.01,−0.02,0.03,−0.01] and y=[0.02,0.01,−0.01,−0.02] on the same four intervals. Their products are [0.0002,−0.0002,−0.0003,0.0002]. The sum is −0.0001.
The negative result is valid. It indicates that opposite-direction products dominate this small window. It does not say that either asset has negative variance, that the relationship is stable, or that one asset caused the other to move.
Their realized variances are 0.0015 and 0.0010. A realized-correlation normalization would divide−0.0001 by √(0.0015×0.0010), giving approximately −0.0816497. The package returns covariance, not that normalized correlation. If either variance is zero, correlation needs an undefined-state policy rather than division by zero.
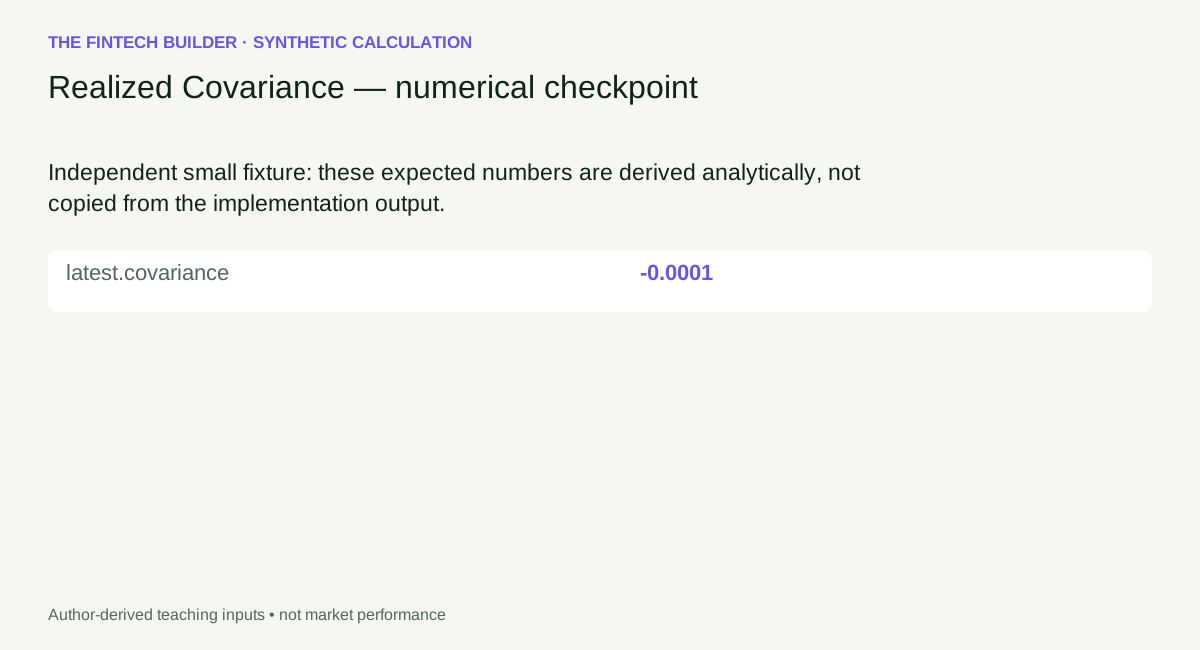
Open this figure at full size.
Download the exact worked input and expected values.
A one-interval shift is a different question
Move y's timestamps forward one sampling interval without changing its values. The numerical arrays still have equal lengths. An index-only implementation would reproduce−0.0001 and quietly attach the wrong meaning to it.
This implementation rejects the mismatch. A deliberately lagged covariance can be useful, but it needs a distinct lagged definition and interpretation. Do not obtain it accidentally through a join bug and label it contemporaneous covariance.
Forward-filling prices is also a modeling choice, not a harmless repair. It can create artificial zero returns followed by delayed jumps. Different liquidity patterns can then distort apparent co-movement. If you use a synchronization scheme in production, preserve its rule, its missingness diagnostics and the unmodified source timestamps.
From one pair to a usable matrix
On a shared complete grid, Σr_i r_iᵀ is positive semidefinite: for any portfolio weights a, aᵀΣa=Σ(aᵀr_i)²≥0. This is an author-derived algebraic check, not an empirical claim about future portfolio risk.
If every pair uses a different subset of intervals, the resulting cells may no longer form one common outer-product sum. A symmetric-looking matrix can then fail the positive-semidefinite property. Pairwise deletion is therefore not merely a row-count detail when a downstream optimizer expects a coherent covariance matrix.
| Change | Expected effect | Diagnostic meaning |
|---|---|---|
| Flip all y returns' signs | Covariance changes sign | Same magnitudes, reversed direction |
| Double all x returns | Covariance doubles | Bilinear scaling |
| Shuffle y without its timestamps | Invalid provenance | Apparent co-movement is no longer auditable |
| Shift y timestamps | Rejection | Exact-grid contract no longer holds |
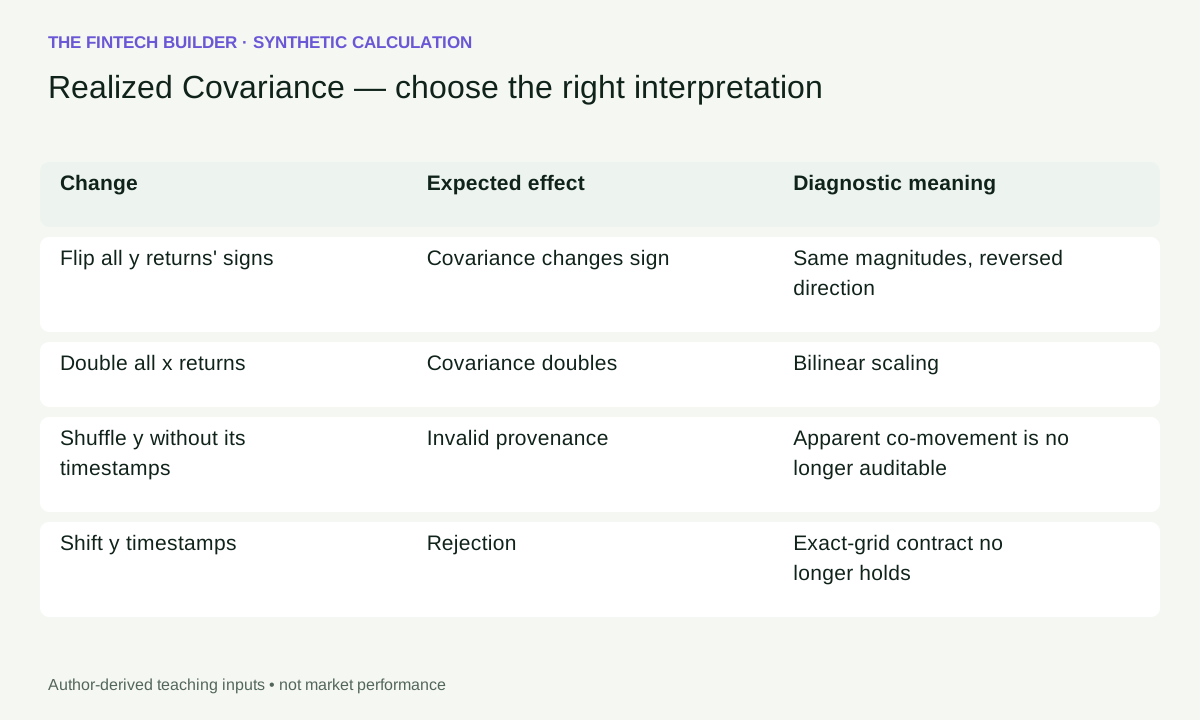
Open this figure at full size.
Use the playground to inspect the pairs
Step through 64 synthetic synchronized observations. Each step changes the available prefix and the products inside the active window. The paired-return view and contribution table should explain the headline covariance, including negative contributions; there is no “negative means broken” color convention.
Try the sign-change comparison and predict the result before looking. Then choose the alignment failure. The error should identify the clock problem instead of displaying a canned number. Reset restores both the numeric data and the timestamps.
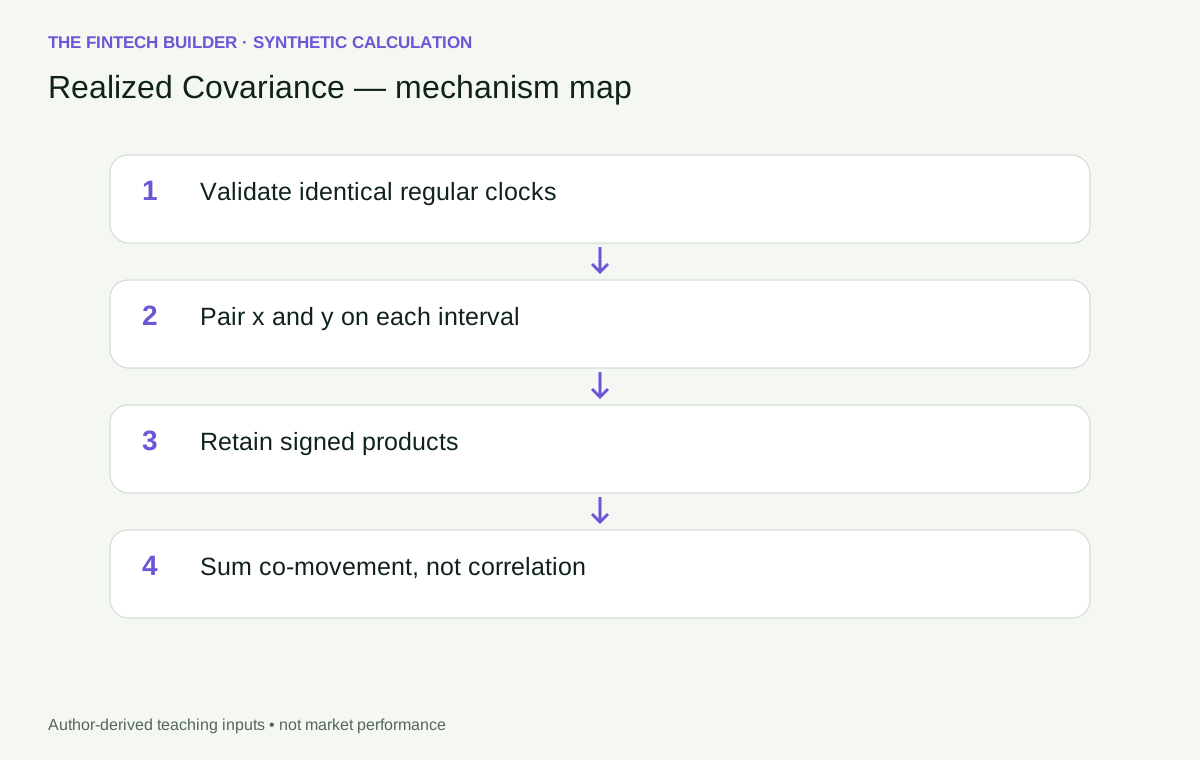
Open this figure at full size.
Open the standalone guided playground. The embedded playground and runnable code are available on this page. Download the 64-observation teaching input.
Implementation and operational limits
The direct rolling calculation is O(nw). A streaming version can maintain a rolling sum of products, but synchronization remains an upstream concern. Tests should cover matching lengths with mismatched clocks, irregular spacing, duplicate timestamps, nonfinite returns, sign reversal and window membership.
The default scale is A=1: covariance over the sampled window, in squared decimal-return units. Multiplying by an annualization factor only makes sense when the period and assumptions justify it. Do not mix daily variance diagonals with annualized off-diagonal covariances.
This exact-grid estimator is useful for explaining a covariance cell and auditing a synchronized panel. It does not solve asynchronous trading, quote noise, lead–lag estimation, or structural breaks. For a daily cross-sectional matrix with estimated means, move to sample covariance; that is a different sampling question with a different denominator.
Reproduce and inspect the calculation
The Python and TypeScript tabs contain standalone implementations, not imports into an unseen runtime. Both expose calculate(input_data). Feed the worked JSON's input object into that entry point. For the longer experiment, use the teaching-path JSON directly.
import json
from pathlib import Path
from realized_covariance import calculate

data = json.loads(Path("teaching-path.json").read_text())
result = calculate(data)
print(result["latest"])
import {calculate} from './realized_covariance.ts';
const result = calculate(inputData); // inputData is the downloaded JSON object
console.log(result.latest);
Place the downloaded input beside your script and the standalone source on its import path. The Python reference uses the standard library; the TypeScript reference has no external runtime dependency. Shared tests include independent numeric anchors, valid boundaries, rejected inputs and cross-language output comparisons. They establish arithmetic, not forecasting performance.
Evidence and scope
This article uses authored synthetic calculations and primary technical references, reviewed 2026-09-10. Historical market examples are deferred until identity, adjustment basis, chronology and redistribution rights can be verified. No personal trading history or search-ranking superiority is asserted.
Two strictly increasing UTC timestamp arrays must match exactly, including grid spacing. No filling or pairwise deletion.
Continue the investigation
- Realized Variance: compare its assumptions and information boundary before comparing the numbers.
- Realized Kernel: compare its assumptions and information boundary before comparing the numbers.
Rendered from the canonical Mermaid sources linked by this article.
Realized Covariance — calculation-flow
Realized Covariance — decision-boundary
ReferencesPrimary sources and evidence notesExpand the source trail, evidence role, and limitations behind the engineering choices.
Expand the source trail, evidence role, and limitations behind the engineering choices.
Reviewed 2026-09-10. Primary technical documentation and papers; synthetic arithmetic is author-derived. This is a targeted source review, not a verified review of Google's top ten results and not a claim of ranking superiority.
- S1: highfrequency — ICov estimator documentation — accessed 2026-09-10. Rolling official documentation snapshot; exact package versions used for numerical comparisons are recorded in the repair numeric-evidence.json. Supports the definition and declared convention, not investment performance. Jurisdiction: not applicable to this mathematical reference.
Scope of evidence
Two strictly increasing UTC timestamp arrays must match exactly, including grid spacing. No filling or pairwise deletion.
Historical case: deferred. No public provider dataset, historical performance claim, or personal trading anecdote is used. Synthetic examples demonstrate arithmetic, not market efficacy. Sources are not copied as article prose.
Accessed: 2026-09-10.
Supports: estimator definition and the explicitly declared variants.
Limitations: technical documentation does not verify a real market feed, author experience, forecast efficacy or search-result superiority. Original-paper access limitations are recorded in the repair report.
Full dependency-light reference implementations in both supported languages.
/** Standalone D10-F02-A02 reference. Generated from validated D10 v2 source. */
export class ContractError extends Error {}
type RecordValue=Record<string, any>;
type Matrix=number[][];
const sum=(x:number[]):number=>x.reduce((a,b)=>a+b,0);


function requireValue(ok: unknown, code: string, message: string): asserts ok {
  if (!ok) throw new ContractError(`${code}: ${message}`);
}

function finite(x: unknown, name: string): number {
  requireValue(typeof x === 'number' && Number.isFinite(x), 'NUMBER', `${name} must be a finite number`);
  return x;
}

function integer(x: unknown, name: string, minimum = 0, maximum = 10000): number {
  const v = finite(x, name);
  requireValue(Number.isInteger(v) && v >= minimum && v <= maximum, 'INTEGER', `${name} must be an integer in [${minimum}, ${maximum}]`);
  return v;
}

function param(p: RecordValue, key: string, fallback: number): number {
  return finite(Object.hasOwn(p, key) ? p[key] : fallback, key);
}

function option(p: RecordValue, key: string, fallback: any): any {
  return Object.hasOwn(p, key) ? p[key] : fallback;
}

function positive(p: RecordValue, key: string, fallback: number): number {
  const v = param(p, key, fallback);
  requireValue(v > 0, 'RANGE', `${key} must be positive`);
  return v;
}

function vector(value: unknown, name: string, minimum = 1): number[] {
  requireValue(Array.isArray(value) && value.length >= minimum, 'SHAPE', `${name} needs ${minimum} or more values`);
  return value.map((v, i) => finite(v, `${name}[${i}]`));
}

function timestamps(values: unknown, n: number, name: string, regular = false): number[] {
  requireValue(Array.isArray(values) && values.length === n, 'TIME', `${name} must match observation count`);
  const result: number[] = [];
  for (const value of values) {
    requireValue(typeof value === 'string' && /^\d{4}-\d{2}-\d{2}T\d{2}:\d{2}:\d{2}(?:\.\d{3})?Z$/.test(value), 'TIME', 'use UTC ISO timestamps');
    const instant = Date.parse(value);
    const canonical = value.length === 20 ? value.replace('Z', '.000Z') : value;
    requireValue(Number.isFinite(instant) && Number(value.slice(0, 4)) >= 1000 && new Date(instant).toISOString() === canonical, 'TIME', 'invalid calendar timestamp');
    requireValue(!result.length || instant > result[result.length - 1], 'TIME', 'timestamps must strictly increase');
    result.push(instant);
  }
  if (regular && n > 2) requireValue(result.slice(2).every((v, i) => v - result[i + 1] === result[1] - result[0]), 'ALIGNMENT', 'returns need a regular grid');
  return result;
}

function seriesResult(series: (RecordValue | null)[], diagnostics: RecordValue): RecordValue {
  const at = series.findIndex(v => v !== null);
  return {series, latest: series.at(-1) ?? null, ready: series.length > 0 && series.at(-1) !== null,
    ready_at: at < 0 ? null : at, diagnostics};
}

function normalQuantile(probability: number): number {
  const a = [-39.69683028665376, 220.9460984245205, -275.9285104469687, 138.3577518672690, -30.66479806614716, 2.506628277459239];
  const b = [-54.47609879822406, 161.5858368580409, -155.6989798598866, 66.80131188771972, -13.28068155288572];
  const c = [-.007784894002430293, -.3223964580411365, -2.400758277161838, -2.549732539343734, 4.374664141464968, 2.938163982698783];
  const d = [.007784695709041462, .3224671290700398, 2.445134137142996, 3.754408661907416];
  const poly = (co: number[], x: number) => co.slice(1).reduce((v, coefficient) => v * x + coefficient, co[0]);
  if (probability < .02425 || probability > .97575) {
    const q = Math.sqrt(-2 * Math.log(Math.min(probability, 1 - probability)));
    const value = poly(c, q) / (poly(d, q) * q + 1);
    return probability < .5 ? value : -value;
  }
  const q = probability - .5;
  return poly(a, q * q) * q / (poly(b, q * q) * q * q + 1);
}

function realized(data: RecordValue, p: RecordValue, kind: string): RecordValue {
  const key = kind === 'realized_covariance' ? 'returns_x' : 'returns', r = vector(data[key], key);
  const w = integer(option(p, 'window', 24), 'window', kind === 'jump_detector' ? 3 : 2), scale = positive(p, 'annualization_factor', 1);
  let y: number[] = [];
  if (kind === 'realized_covariance') {
    y = vector(data.returns_y, 'returns_y');
    const tx = timestamps(data.timestamps_x, r.length, 'timestamps_x', true), ty = timestamps(data.timestamps_y, y.length, 'timestamps_y', true);
    requireValue(tx.length === ty.length && tx.every((v, i) => v === ty[i]), 'ALIGNMENT', 'x/y intervals must match exactly');
  } else if (Object.hasOwn(data, 'timestamps')) timestamps(data.timestamps, r.length, 'timestamps', true);
  const alpha = kind === 'jump_detector' ? param(p, 'alpha', .05) : null;
  if (alpha !== null) requireValue(alpha >= 1e-6 && alpha < .5, 'RANGE', 'alpha must be in [0.000001, 0.5)');
  const bandwidth = kind === 'realized_kernel' ? integer(option(p, 'bandwidth', Math.min(4, w - 1)), 'bandwidth', 0, w - 1) : 0;
  const series = r.map((_, i) => {
    if (i + 1 < w) return null;
    const x = r.slice(i - w + 1, i + 1), squares = x.map(v => v * v), rv = scale * sum(squares);
    const products = x.slice(1).map((v, j) => Math.abs(v * x[j])), bv = scale * Math.PI / 2 * sum(products);
    let item: RecordValue;
    if (kind === 'realized_variance') item = {variance: rv, volatility: Math.sqrt(rv), contributions: squares.map(v => scale * v)};
    else if (kind === 'realized_covariance') {
      const paired = x.map((v, j) => scale * v * y[i - w + 1 + j]);
      item = {covariance: sum(paired), contributions: paired};
    } else if (kind === 'bipower_variation') item = {realized_variance: rv, bipower_variation: bv, signed_difference: rv - bv, jump_variation: Math.max(rv - bv, 0), contributions: products.map(v => scale * Math.PI / 2 * v)};
    else if (kind === 'jump_detector') {
      const mu43 = .8308609250295592;
      const tq = scale ** 2 * w * w / (w - 2) * sum(x.slice(2).map((v, j) => Math.abs(v * x[j + 1] * x[j]) ** (4 / 3))) / mu43 ** 3;
      const se = Math.sqrt((Math.PI ** 2 / 4 + Math.PI - 5) * tq / w), z = se > 0 ? (rv - bv) / se : null;
      const q = normalQuantile(1 - alpha!);
      item = {realized_variance: rv, bipower_variation: bv, tripower_quarticity: tq, standard_error: se, statistic: z,
        critical_value: q, jump_detected: z === null ? null : z > q, decision_status: z === null ? 'withheld-zero-quarticity' : 'asymptotic', signed_difference: rv - bv};
    } else {
      const lags = Array.from({length: bandwidth + 1}, (_, h) => {
        const gamma = sum(x.slice(h).map((v, j) => v * x[j])), weight = 1 - h / (bandwidth + 1);
        return {lag: h, weight, gamma, contribution: scale * (h === 0 ? 1 : 2) * weight * gamma};
      });
      const value = sum(lags.map(v => v.contribution));
      requireValue(value >= -1e-12 * Math.max(rv, 1e-300), 'NUMERIC', 'Bartlett quadratic form became negative');
      item = {realized_kernel: Math.max(value, 0), volatility: Math.sqrt(Math.max(value, 0)), bandwidth, lags};
    }
    return {...item, window_start: i - w + 1, window_end: i};
  });
  return seriesResult(series, {causal: true, input_count: r.length, annualization_factor: scale});
}
export function calculate(data: RecordValue): RecordValue {
  requireValue(data && typeof data === 'object' && !Array.isArray(data),'SHAPE','input must be an object');
  const p=Object.hasOwn(data,'parameters')?data.parameters:{};
  requireValue(p && typeof p === 'object' && !Array.isArray(p),'SHAPE','parameters must be an object');
  const result=realized(data,p,"realized_covariance");
  function check(v:any):void {
    if(typeof v==='number')requireValue(Number.isFinite(v),'NUMERIC','nonfinite computed output');
    else if(Array.isArray(v))v.forEach(check);
    else if(v && typeof v==='object')Object.values(v).forEach(check);
  }
  check(result);
  return {topic_id:"D10-F02-A02",title:"Realized Covariance",parameters:p,...result};
}
The embedded lab now expands to its full document height, keeping the article as the only scroll surface.