
 By Islam Baraka
For analysts and developers who know decimal interval returns, regular sampling grids, and variance versus volatility. The goal is to reproduce the mechanism, inspect its failure states, and decide what the output can legitimately tell you—not to fit or endorse a trading strategy.
A large isolated return dominates realized variance because it is squared. Bipower variation replaces each square with the product of adjacent absolute returns. That changes how an isolated jump enters the calculation—and makes the neighboring observations essential to the explanation.
The useful intuition is not “BV deletes jumps.” It does not delete observations. Its jump-robust interpretation is asymptotic and depends on the price process and sampling assumptions. This tutorial keeps the finite-sample arithmetic visible so that interpretation does not become an unjustified guarantee.
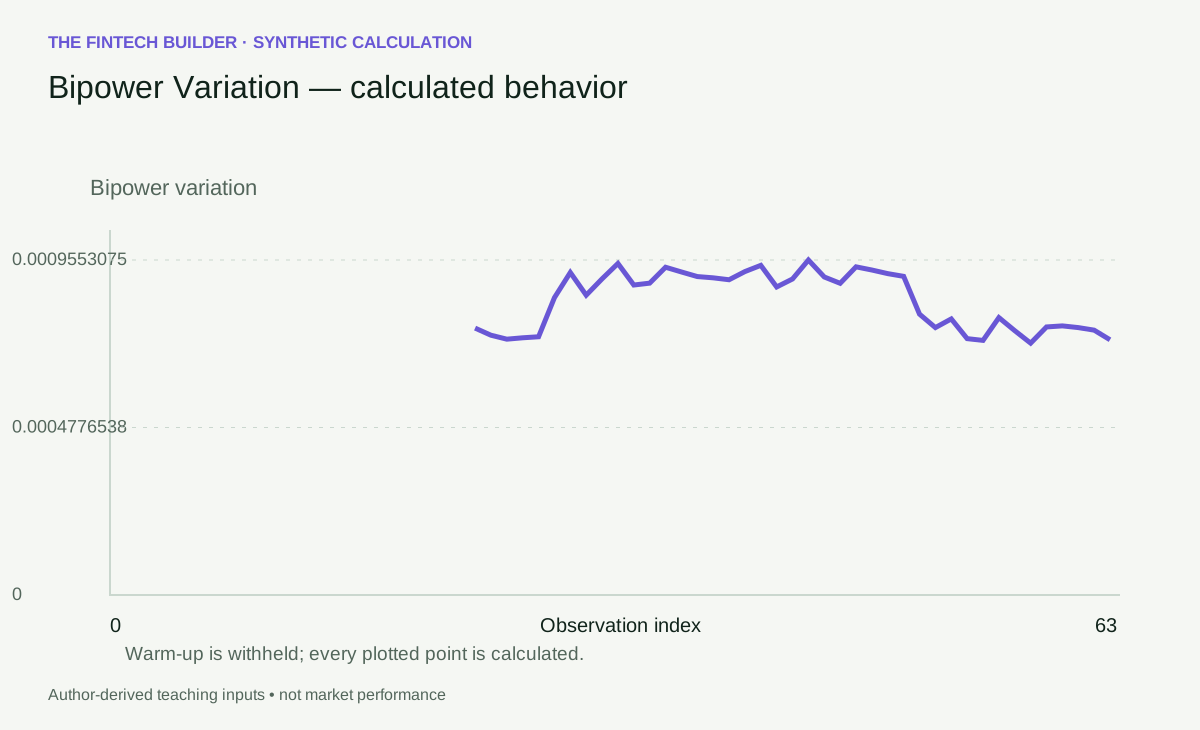
Open this figure at full size.
Why the normalization is π/2
For a standard normal variable Z, E|Z|=√(2/π). The product of two independent absolute standardized normal variables therefore has expectation 2/π. Multiplying adjacent absolute-return products by its reciprocal, π/2, gives the familiar bipower normalization.
The univariate form used here is BV=(π/2)Σ_(i=2)^n |r_i||r_(i-1)|. It follows from the diagonal of the documented bipower covariance construction. We use the unadjusted boundary convention: n returns create n−1 products, with no extra n/(n−1) factor. Other finite-sample conventions must not be compared as if they were identical.
Absolute values remove direction. Changing a return's sign without changing its magnitude leaves BV unchanged. Changing its position can matter because it changes which magnitudes are neighbors.
A short sample where BV exceeds RV
Take [0.01,−0.02,0.03,−0.01]. Adjacent absolute products are 0.0002,0.0006 and 0.0003. Their sum is 0.0011, so BV=(π/2)×0.0011≈0.001727876.
The realized variance is 0.0015. Thus RV−BV≈−0.000227876. That negative difference is perfectly possible in a finite sample. It is not evidence of a “negative jump,” and it is not a reason to change the BV formula.
The output preserves signed_difference for diagnosis and separately reports jump_variation=max(RV−BV,0). The nonnegative version is a bounded descriptive proxy. Clipping does not turn it into a statistically established jump contribution.
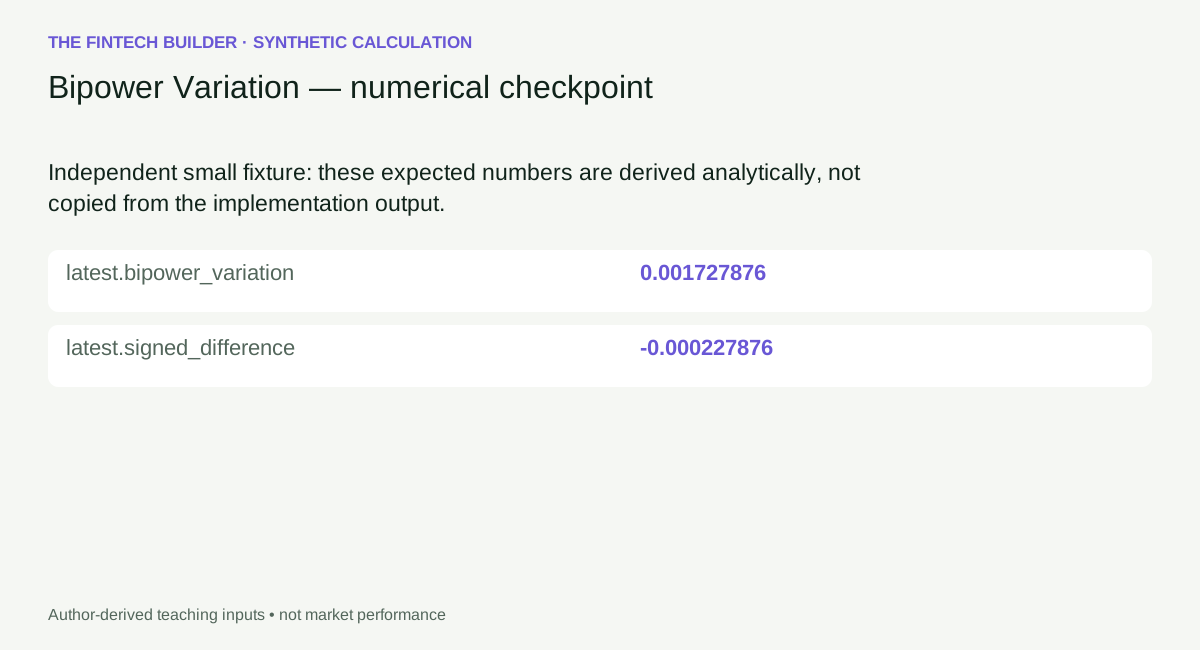
Open this figure at full size.
Download the exact worked input and expected values.
Trace an isolated large observation
If an interior return r_j becomes large while its neighbors remain small, RV gains a term proportional to r_j². BV instead includes |r_(j−1)||r_j| and |r_j||r_(j+1)|. For fixed neighbors those terms grow linearly in the jump magnitude, not quadratically.
That finite calculation explains the direction of the jump-robust argument. It also exposes its limits. Consecutive large observations, noise, finite sampling and boundary placement can materially affect the result. A jump at the first or last return touches only one adjacent product; an interior jump touches two.
Do not diagnose a market jump from one screenshot of RV above BV. You need a sampling policy, a test calibration if making a significance claim, and an investigation of whether the move was a price event or a data problem.
The comparison that matters
| Quantity | Construction | What it does not establish |
|---|---|---|
| RV | Sum of squared returns | Continuous versus jump decomposition |
| BV | Scaled adjacent absolute products | Exact finite-sample continuous variance |
| Signed RV−BV | Difference of two estimators | Nonnegative realized jump size |
| max(RV−BV,0) | Clipped descriptive proxy | Statistical significance |
This table is an operational safeguard. A downstream dashboard should not relabel the last row “confirmed jumps.” The jump-variation detector adds a declared asymptotic statistic and quarticity estimate, with its own limitations.
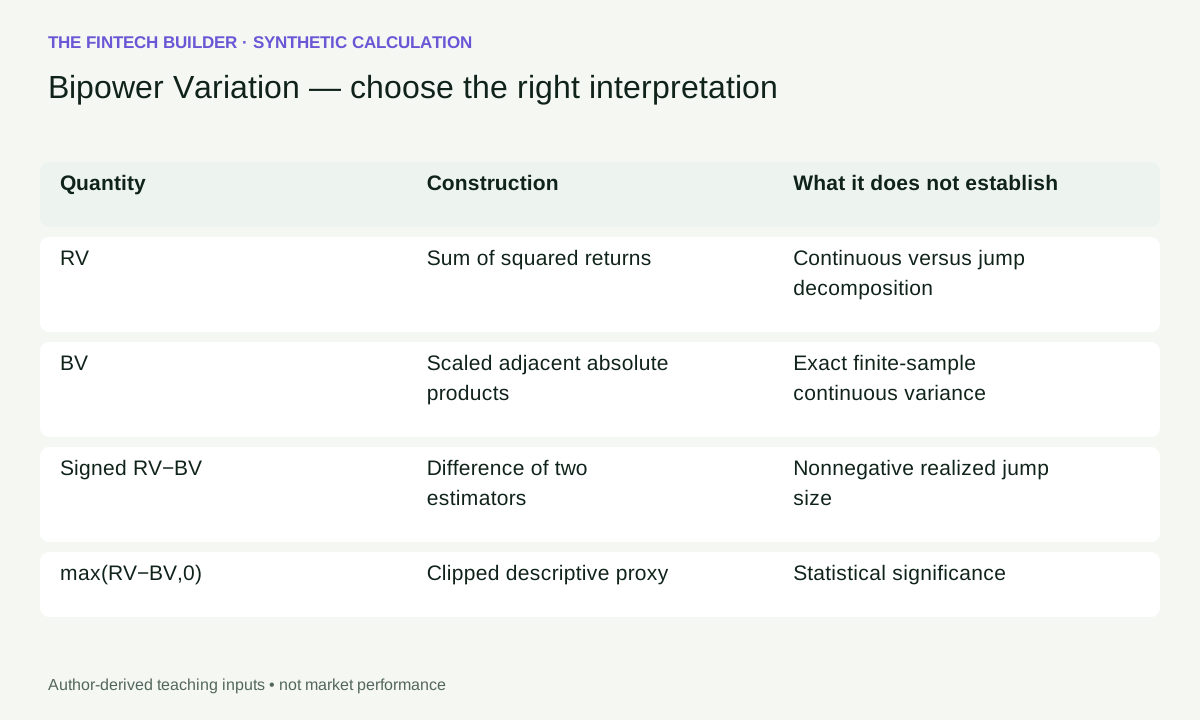
Open this figure at full size.
What to notice in the playground
Step through the 64-return synthetic path and identify the adjacent products affected by its conspicuous shock. Compare the clean path, an injected-shock path and a zero-path boundary. The table reveals which neighbor products changed; the chart is calculated from the same prefix.
Change the window and inspect its first retained return. Its predecessor outside the window must not quietly enter the sum. The first product uses the first two returns inside the selected window. This is an easy boundary error to miss if only the final total is shown.
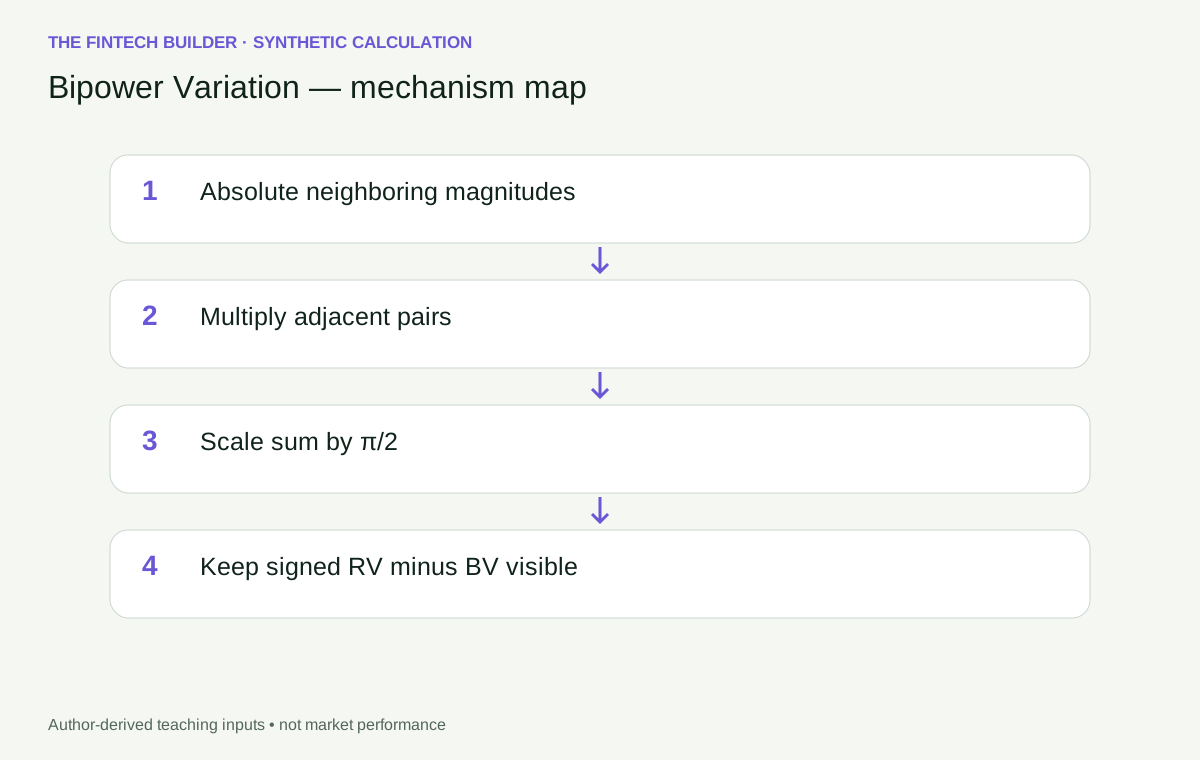
Open this figure at full size.
Open the standalone guided playground. The embedded playground and runnable code are available on this page. Download the 64-observation teaching input.
Implementation, units and failure states
Inputs are finite decimal log returns on a declared regular grid. When timestamps are supplied, the runtime validates spacing and ordering. Missing returns are not replaced with zero. There is no automatic outlier removal: an extreme observation is precisely the case you need to inspect.
The default output is integrated variance over the window, with A=1. If you rescale all returns by c, RV and BV both scale by c². If you multiply the reported variance by an annualization factor, apply the same convention to both quantities before comparing them.
Two returns are enough to calculate one bipower product. That is mathematical readiness, not a defensible sample size for asymptotic inference. The small worked example proves arithmetic; the 64-observation lab reveals state changes; neither proves forecast performance or adequacy for a particular real market feed.
My reading rule is to keep RV, BV, the signed difference, and the neighboring magnitudes together. The extra value is understanding why the estimators disagree, not turning the disagreement into a confident story the data cannot support.
Reproduce and inspect the calculation
The Python and TypeScript tabs contain standalone implementations, not imports into an unseen runtime. Both expose calculate(input_data). Feed the worked JSON's input object into that entry point. For the longer experiment, use the teaching-path JSON directly.
import json
from pathlib import Path
from bipower_variation import calculate

data = json.loads(Path("teaching-path.json").read_text())
result = calculate(data)
print(result["latest"])
import {calculate} from './bipower_variation.ts';
const result = calculate(inputData); // inputData is the downloaded JSON object
console.log(result.latest);
Place the downloaded input beside your script and the standalone source on its import path. The Python reference uses the standard library; the TypeScript reference has no external runtime dependency. Shared tests include independent numeric anchors, valid boundaries, rejected inputs and cross-language output comparisons. They establish arithmetic, not forecasting performance.
Evidence and scope
This article uses authored synthetic calculations and primary technical references, reviewed 2026-09-10. Historical market examples are deferred until identity, adjustment basis, chronology and redistribution rights can be verified. No personal trading history or search-ranking superiority is asserted.
Unadjusted boundary convention; no w/(w-1) correction. Report signed RV-BV separately from max(RV-BV,0).
Continue the investigation
- Realized Variance: compare its assumptions and information boundary before comparing the numbers.
- Realized Kernel: compare its assumptions and information boundary before comparing the numbers.
Rendered from the canonical Mermaid sources linked by this article.
Bipower Variation — calculation-flow
Bipower Variation — decision-boundary
ReferencesPrimary sources and evidence notesExpand the source trail, evidence role, and limitations behind the engineering choices.
Expand the source trail, evidence role, and limitations behind the engineering choices.
Reviewed 2026-09-10. Primary technical documentation and papers; synthetic arithmetic is author-derived. This is a targeted source review, not a verified review of Google's top ten results and not a claim of ranking superiority.
- S1: highfrequency — rBPCov estimator documentation — accessed 2026-09-10. Rolling official documentation snapshot; exact package versions used for numerical comparisons are recorded in the repair numeric-evidence.json. Supports the definition and declared convention, not investment performance. Jurisdiction: not applicable to this mathematical reference.
Scope of evidence
Unadjusted boundary convention; no w/(w-1) correction. Report signed RV-BV separately from max(RV-BV,0).
Historical case: deferred. No public provider dataset, historical performance claim, or personal trading anecdote is used. Synthetic examples demonstrate arithmetic, not market efficacy. Sources are not copied as article prose.
Accessed: 2026-09-10.
Supports: estimator definition and the explicitly declared variants.
Limitations: technical documentation does not verify a real market feed, author experience, forecast efficacy or search-result superiority. Original-paper access limitations are recorded in the repair report.
Full dependency-light reference implementations in both supported languages.
/** Standalone D10-F02-A03 reference. Generated from validated D10 v2 source. */
export class ContractError extends Error {}
type RecordValue=Record<string, any>;
type Matrix=number[][];
const sum=(x:number[]):number=>x.reduce((a,b)=>a+b,0);


function requireValue(ok: unknown, code: string, message: string): asserts ok {
  if (!ok) throw new ContractError(`${code}: ${message}`);
}

function finite(x: unknown, name: string): number {
  requireValue(typeof x === 'number' && Number.isFinite(x), 'NUMBER', `${name} must be a finite number`);
  return x;
}

function integer(x: unknown, name: string, minimum = 0, maximum = 10000): number {
  const v = finite(x, name);
  requireValue(Number.isInteger(v) && v >= minimum && v <= maximum, 'INTEGER', `${name} must be an integer in [${minimum}, ${maximum}]`);
  return v;
}

function param(p: RecordValue, key: string, fallback: number): number {
  return finite(Object.hasOwn(p, key) ? p[key] : fallback, key);
}

function option(p: RecordValue, key: string, fallback: any): any {
  return Object.hasOwn(p, key) ? p[key] : fallback;
}

function positive(p: RecordValue, key: string, fallback: number): number {
  const v = param(p, key, fallback);
  requireValue(v > 0, 'RANGE', `${key} must be positive`);
  return v;
}

function vector(value: unknown, name: string, minimum = 1): number[] {
  requireValue(Array.isArray(value) && value.length >= minimum, 'SHAPE', `${name} needs ${minimum} or more values`);
  return value.map((v, i) => finite(v, `${name}[${i}]`));
}

function timestamps(values: unknown, n: number, name: string, regular = false): number[] {
  requireValue(Array.isArray(values) && values.length === n, 'TIME', `${name} must match observation count`);
  const result: number[] = [];
  for (const value of values) {
    requireValue(typeof value === 'string' && /^\d{4}-\d{2}-\d{2}T\d{2}:\d{2}:\d{2}(?:\.\d{3})?Z$/.test(value), 'TIME', 'use UTC ISO timestamps');
    const instant = Date.parse(value);
    const canonical = value.length === 20 ? value.replace('Z', '.000Z') : value;
    requireValue(Number.isFinite(instant) && Number(value.slice(0, 4)) >= 1000 && new Date(instant).toISOString() === canonical, 'TIME', 'invalid calendar timestamp');
    requireValue(!result.length || instant > result[result.length - 1], 'TIME', 'timestamps must strictly increase');
    result.push(instant);
  }
  if (regular && n > 2) requireValue(result.slice(2).every((v, i) => v - result[i + 1] === result[1] - result[0]), 'ALIGNMENT', 'returns need a regular grid');
  return result;
}

function seriesResult(series: (RecordValue | null)[], diagnostics: RecordValue): RecordValue {
  const at = series.findIndex(v => v !== null);
  return {series, latest: series.at(-1) ?? null, ready: series.length > 0 && series.at(-1) !== null,
    ready_at: at < 0 ? null : at, diagnostics};
}

function normalQuantile(probability: number): number {
  const a = [-39.69683028665376, 220.9460984245205, -275.9285104469687, 138.3577518672690, -30.66479806614716, 2.506628277459239];
  const b = [-54.47609879822406, 161.5858368580409, -155.6989798598866, 66.80131188771972, -13.28068155288572];
  const c = [-.007784894002430293, -.3223964580411365, -2.400758277161838, -2.549732539343734, 4.374664141464968, 2.938163982698783];
  const d = [.007784695709041462, .3224671290700398, 2.445134137142996, 3.754408661907416];
  const poly = (co: number[], x: number) => co.slice(1).reduce((v, coefficient) => v * x + coefficient, co[0]);
  if (probability < .02425 || probability > .97575) {
    const q = Math.sqrt(-2 * Math.log(Math.min(probability, 1 - probability)));
    const value = poly(c, q) / (poly(d, q) * q + 1);
    return probability < .5 ? value : -value;
  }
  const q = probability - .5;
  return poly(a, q * q) * q / (poly(b, q * q) * q * q + 1);
}

function realized(data: RecordValue, p: RecordValue, kind: string): RecordValue {
  const key = kind === 'realized_covariance' ? 'returns_x' : 'returns', r = vector(data[key], key);
  const w = integer(option(p, 'window', 24), 'window', kind === 'jump_detector' ? 3 : 2), scale = positive(p, 'annualization_factor', 1);
  let y: number[] = [];
  if (kind === 'realized_covariance') {
    y = vector(data.returns_y, 'returns_y');
    const tx = timestamps(data.timestamps_x, r.length, 'timestamps_x', true), ty = timestamps(data.timestamps_y, y.length, 'timestamps_y', true);
    requireValue(tx.length === ty.length && tx.every((v, i) => v === ty[i]), 'ALIGNMENT', 'x/y intervals must match exactly');
  } else if (Object.hasOwn(data, 'timestamps')) timestamps(data.timestamps, r.length, 'timestamps', true);
  const alpha = kind === 'jump_detector' ? param(p, 'alpha', .05) : null;
  if (alpha !== null) requireValue(alpha >= 1e-6 && alpha < .5, 'RANGE', 'alpha must be in [0.000001, 0.5)');
  const bandwidth = kind === 'realized_kernel' ? integer(option(p, 'bandwidth', Math.min(4, w - 1)), 'bandwidth', 0, w - 1) : 0;
  const series = r.map((_, i) => {
    if (i + 1 < w) return null;
    const x = r.slice(i - w + 1, i + 1), squares = x.map(v => v * v), rv = scale * sum(squares);
    const products = x.slice(1).map((v, j) => Math.abs(v * x[j])), bv = scale * Math.PI / 2 * sum(products);
    let item: RecordValue;
    if (kind === 'realized_variance') item = {variance: rv, volatility: Math.sqrt(rv), contributions: squares.map(v => scale * v)};
    else if (kind === 'realized_covariance') {
      const paired = x.map((v, j) => scale * v * y[i - w + 1 + j]);
      item = {covariance: sum(paired), contributions: paired};
    } else if (kind === 'bipower_variation') item = {realized_variance: rv, bipower_variation: bv, signed_difference: rv - bv, jump_variation: Math.max(rv - bv, 0), contributions: products.map(v => scale * Math.PI / 2 * v)};
    else if (kind === 'jump_detector') {
      const mu43 = .8308609250295592;
      const tq = scale ** 2 * w * w / (w - 2) * sum(x.slice(2).map((v, j) => Math.abs(v * x[j + 1] * x[j]) ** (4 / 3))) / mu43 ** 3;
      const se = Math.sqrt((Math.PI ** 2 / 4 + Math.PI - 5) * tq / w), z = se > 0 ? (rv - bv) / se : null;
      const q = normalQuantile(1 - alpha!);
      item = {realized_variance: rv, bipower_variation: bv, tripower_quarticity: tq, standard_error: se, statistic: z,
        critical_value: q, jump_detected: z === null ? null : z > q, decision_status: z === null ? 'withheld-zero-quarticity' : 'asymptotic', signed_difference: rv - bv};
    } else {
      const lags = Array.from({length: bandwidth + 1}, (_, h) => {
        const gamma = sum(x.slice(h).map((v, j) => v * x[j])), weight = 1 - h / (bandwidth + 1);
        return {lag: h, weight, gamma, contribution: scale * (h === 0 ? 1 : 2) * weight * gamma};
      });
      const value = sum(lags.map(v => v.contribution));
      requireValue(value >= -1e-12 * Math.max(rv, 1e-300), 'NUMERIC', 'Bartlett quadratic form became negative');
      item = {realized_kernel: Math.max(value, 0), volatility: Math.sqrt(Math.max(value, 0)), bandwidth, lags};
    }
    return {...item, window_start: i - w + 1, window_end: i};
  });
  return seriesResult(series, {causal: true, input_count: r.length, annualization_factor: scale});
}
export function calculate(data: RecordValue): RecordValue {
  requireValue(data && typeof data === 'object' && !Array.isArray(data),'SHAPE','input must be an object');
  const p=Object.hasOwn(data,'parameters')?data.parameters:{};
  requireValue(p && typeof p === 'object' && !Array.isArray(p),'SHAPE','parameters must be an object');
  const result=realized(data,p,"bipower_variation");
  function check(v:any):void {
    if(typeof v==='number')requireValue(Number.isFinite(v),'NUMERIC','nonfinite computed output');
    else if(Array.isArray(v))v.forEach(check);
    else if(v && typeof v==='object')Object.values(v).forEach(check);
  }
  check(result);
  return {topic_id:"D10-F02-A03",title:"Bipower Variation",parameters:p,...result};
}
The embedded lab now expands to its full document height, keeping the article as the only scroll surface.