
 By Islam Baraka
For analysts and developers who know residuals from a mean model, conditional variance, and lagged information. The goal is to reproduce the mechanism, inspect its failure states, and decide what the output can legitimately tell you—not to fit or endorse a trading strategy.
A single yesterday value can miss a broader volatility regime. HAR-RV combines recent realized variance at several horizons: the latest observation, a five-session mean and a 22-session mean.
The appeal is interpretability. You can inspect the features and their coefficients separately. But a transparent linear combination still needs honest timing, units and forecast evaluation. A plausible line is not evidence that the chosen coefficients were learned from data.
This package implements a level-variance HAR with supplied coefficients and fixed 1/5/22 observed-session horizons. It does not fit a regression or silently switch to a log-volatility version.
Open this figure at full size.
Assemble features at the same cutoff
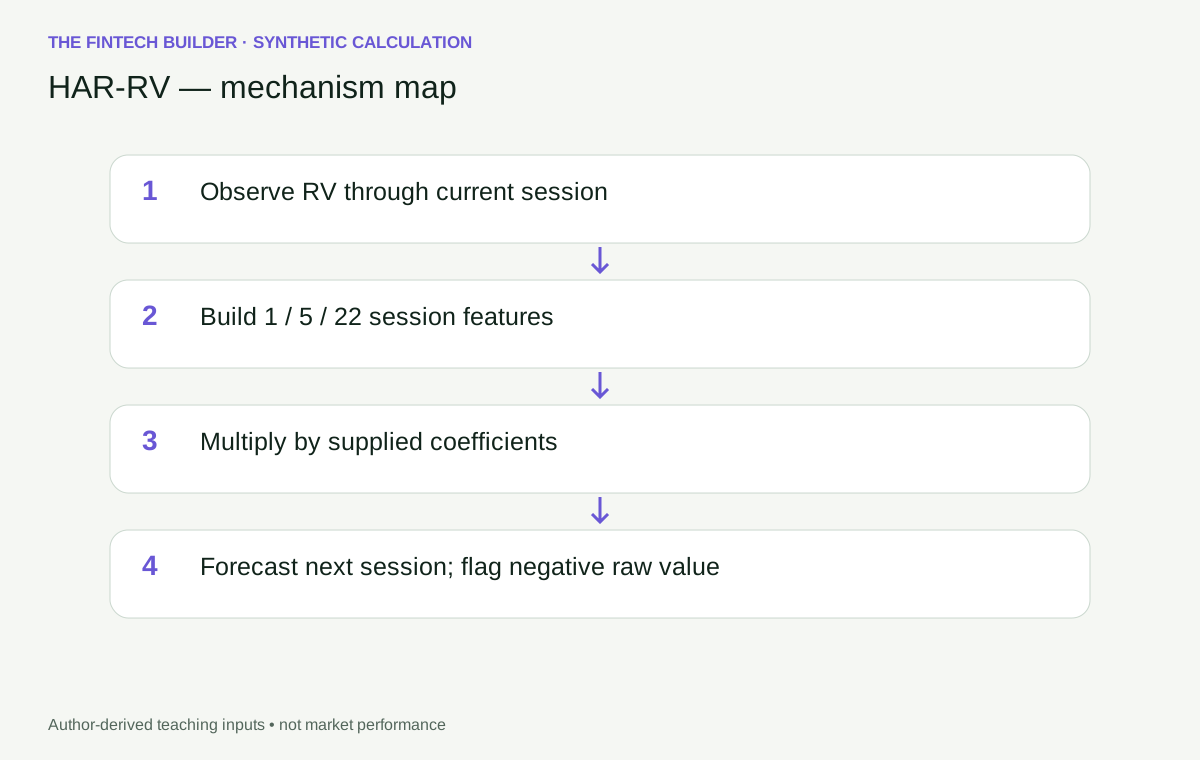
At the end of session t, define the daily feature D_t=RV_t, weekly feature W_t=mean(RV_(t−4),…,RV_t), and monthly feature M_t=mean(RV_(t−21),…,RV_t). The next-session forecast is
The HAR model documentation describes horizon-based realized-volatility regressions and their variants. This contract fixes the target and transforms rather than using the broad HAR label to hide them.
All three features include the latest available session. They overlap; weekly and monthly are not disjoint buckets. That overlap is intended. If you remove the latest day from one feature, you have specified a different regression.
The first forecast exists after 22 observations
Zero-based index 21 is the first point with a complete 22-session monthly feature. Its output predicts index 22, which has not yet been observed at that cutoff.
Starting at index 22 instead withholds one valid forecast. Using RV_(t+1) anywhere in the features leaks the target. Both mistakes can occur while a plotted line looks reasonable, which is why the output records index and forecast_index separately.
The windows count supplied observed sessions, not calendar days. Holidays do not automatically become zero-RV days. The caller must provide a consistent session sequence and explain missing measurements.
Calculate a regime-change example
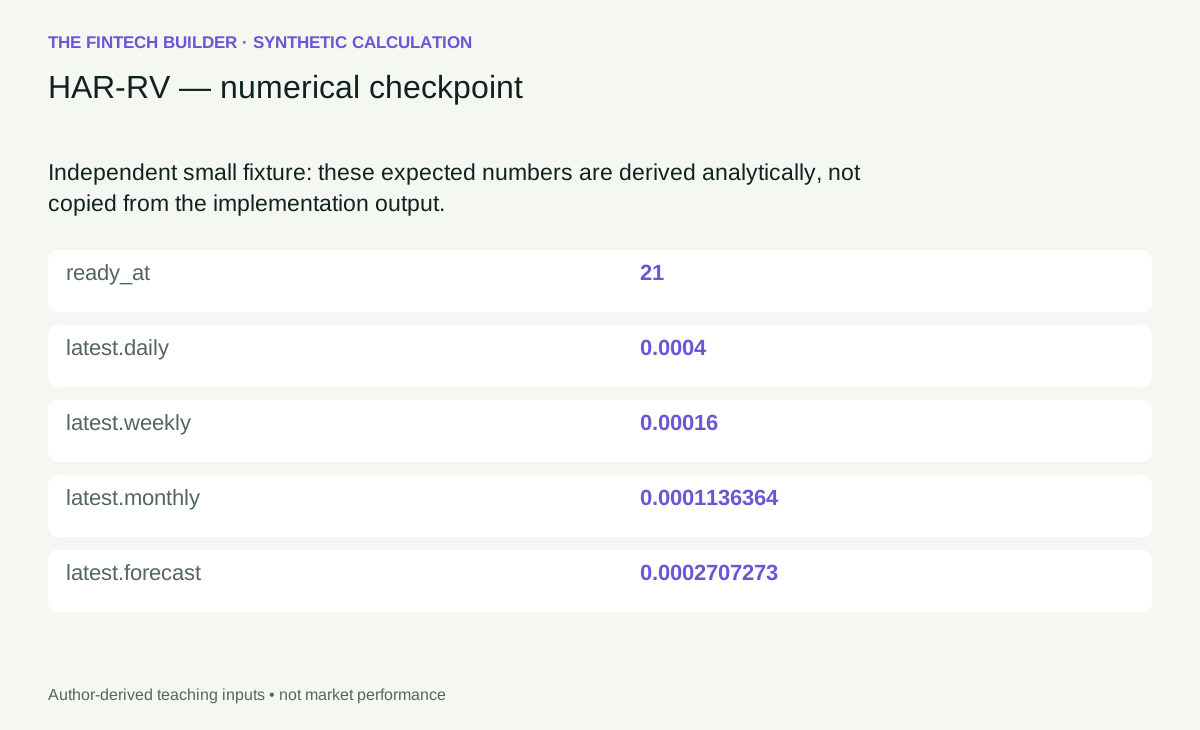
Take 21 synthetic sessions with RV=0.0001 followed by a session with RV=0.0004. At index 21, D=0.0004. The five-session mean is(4×0.0001+0.0004)/5=0.00016. The 22-session mean is(21×0.0001+0.0004)/22=0.0025/22≈0.0001136364.
With b_0=0, b_d=0.5, b_w=0.3 and b_m=0.2, the forecast is 0.0002+0.000048+0.00002272727=0.00027072727. The last-observation baseline is 0.0004.
The HAR value is lower because the weekly and monthly features still reflect the quieter history. That is an explanation of the supplied model's behavior, not proof that the lower prediction will be more accurate tomorrow.
Open this figure at full size.
Download the exact worked input and expected values.
A long-lived feature is not a long-lived coefficient
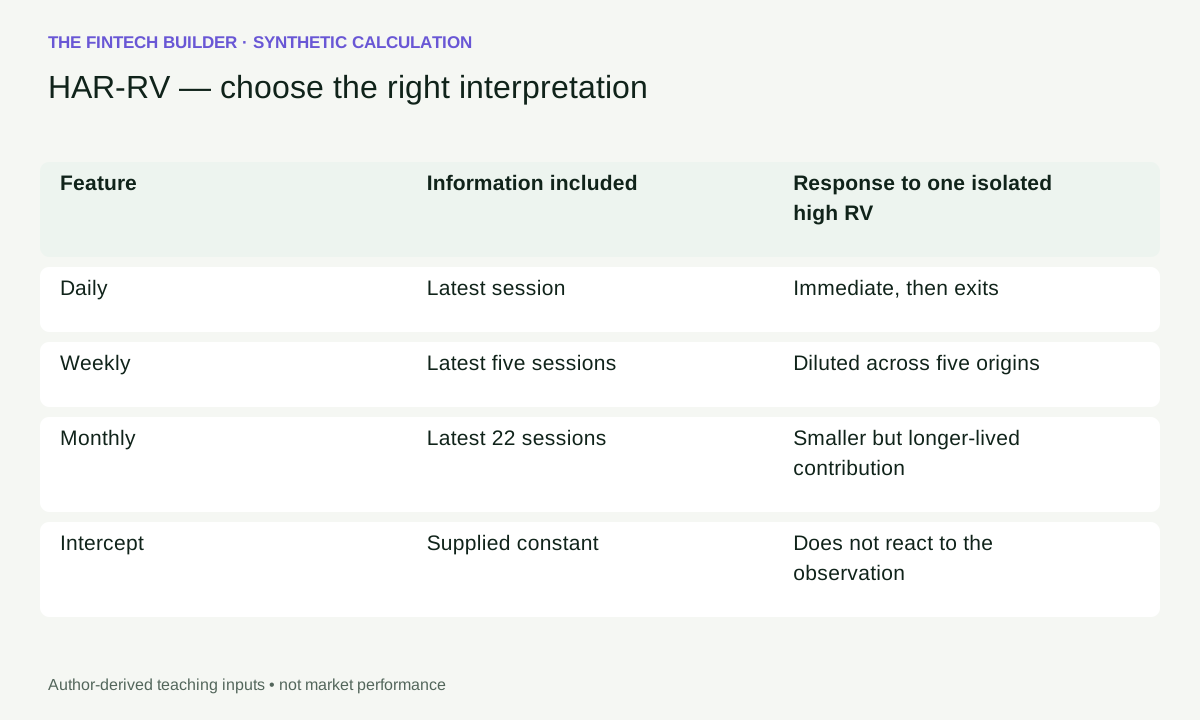
One elevated RV observation remains in the weekly mean for five observed sessions and in the monthly mean for 22. Its direct daily-feature effect lasts one forecast origin. Those feature-membership durations are separate from the coefficient magnitudes.
If the high-volatility regime persists, the weekly and monthly averages gradually catch up. If it was a one-session event, their contributions eventually disappear. Stepping through those entry and exit points is more informative than describing the model vaguely as “multi-horizon memory.”
| Feature | Information included | Response to one isolated high RV |
|---|---|---|
| Daily | Latest session | Immediate, then exits |
| Weekly | Latest five sessions | Diluted across five origins |
| Monthly | Latest 22 sessions | Smaller but longer-lived contribution |
| Intercept | Supplied constant | Does not react to the observation |
Open this figure at full size.
Negative forecasts need a policy, not concealment
Input realized variances must be nonnegative. Regression coefficients, however, can be signed. A linear level model can therefore produce a negative raw forecast.
The runtime preserves forecast_raw, sets valid=false, and withholds the usable forecast when that happens. It does not silently clip the number to zero. A production workflow might choose constrained estimation or a log formulation, but each changes the model and requires its own transformation and evaluation decisions.
A log-HAR forecast also cannot simply be exponentiated and assumed to equal the conditional mean of level variance. Transformation bias and the target functional matter. This article deliberately avoids claiming equivalence among those variants.
Follow the horizons in the playground
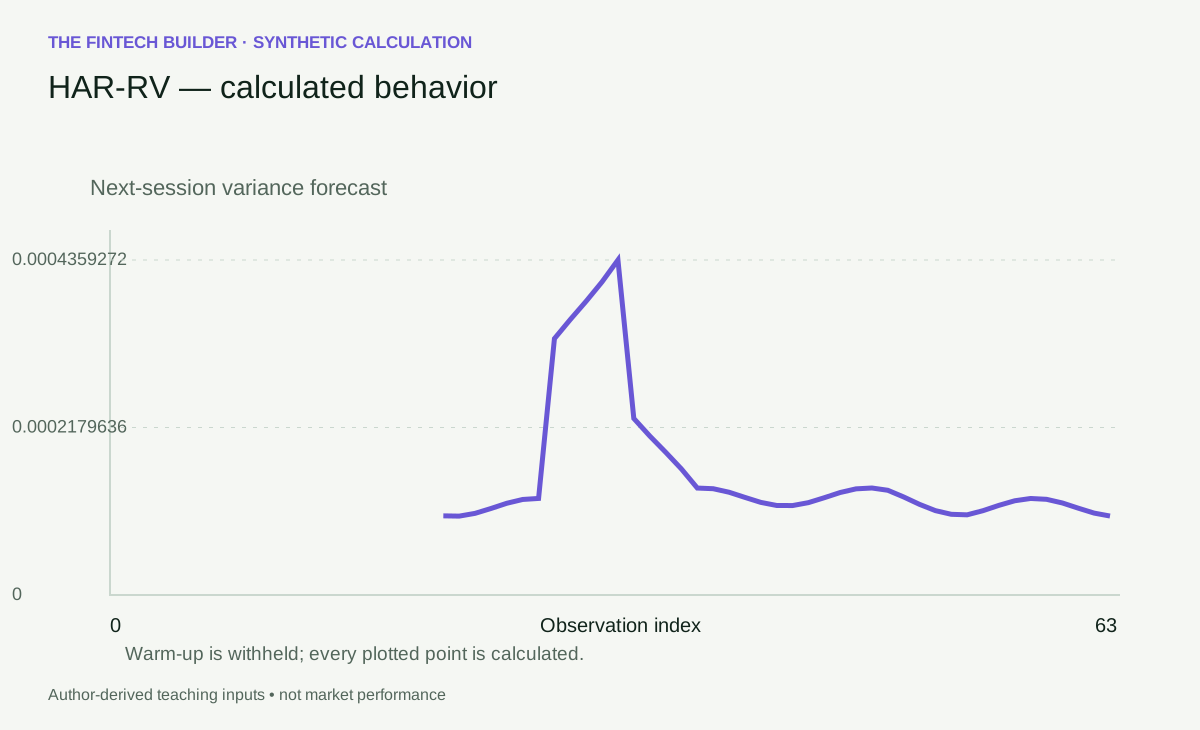
The 64-session synthetic path includes a temporary elevated-variance regime. Step one session at a time and inspect D, W, M, their weighted contributions, the total forecast and the last-value baseline. Changing a coefficient recomputes its contribution while retaining the fixed 1/5/22 horizons.
Predict when the regime's final elevated observation leaves the weekly mean, then the monthly mean. The chart and feature table should identify those exact transitions. The invalid-input scenario demonstrates that a negative observed RV is different from a negative model forecast.
Open this figure at full size.
Open the standalone guided playground. The embedded playground and runnable code are available on this page. Download the 64-observation teaching input.
How to evaluate it on real data
Fit coefficients on data available before each evaluation period. Keep the realized-variance construction consistent between features and target. Compare chronological forecasts with simple baselines, and select a loss function that matches the risk decision. Overlapping features and serially dependent errors affect inference; ordinary fit statistics alone are not a deployment case.
The reference calculation is deterministic and uses explicit feature windows. Its purpose is to make information timing and arithmetic reproducible. It does not report estimated coefficients, in-sample fit, out-of-sample performance or an optimal horizon choice.
Continue from realized variance if the input measurement itself is unclear. A forecast built on inconsistent RV observations can be perfectly coded and still answer the wrong question.
Reproduce and inspect the calculation
The Python and TypeScript tabs contain standalone implementations, not imports into an unseen runtime. Both expose calculate(input_data). Feed the worked JSON's input object into that entry point. For the longer experiment, use the teaching-path JSON directly.
import json
from pathlib import Path
from har_rv import calculate

data = json.loads(Path("teaching-path.json").read_text())
result = calculate(data)
print(result["latest"])
import {calculate} from './har_rv.ts';
const result = calculate(inputData); // inputData is the downloaded JSON object
console.log(result.latest);
Place the downloaded input beside your script and the standalone source on its import path. The Python reference uses the standard library; the TypeScript reference has no external runtime dependency. Shared tests include independent numeric anchors, valid boundaries, rejected inputs and cross-language output comparisons. They establish arithmetic, not forecasting performance.
Evidence and scope
This article uses authored synthetic calculations and primary technical references, reviewed 2026-09-10. Historical market examples are deferred until identity, adjustment basis, chronology and redistribution rights can be verified. No personal trading history or search-ranking superiority is asserted.
Level HAR with fixed 1/5/22 observed-session horizons, first ready index21. Nonnegative input RV. Signed coefficients allowed; negative raw forecasts are returned but usable forecast withheld.
Continue the investigation
Rendered from the canonical Mermaid sources linked by this article.
HAR-RV — calculation-flow
HAR-RV — decision-boundary
ReferencesPrimary sources and evidence notesExpand the source trail, evidence role, and limitations behind the engineering choices.
Expand the source trail, evidence role, and limitations behind the engineering choices.
Reviewed 2026-09-10. Primary technical documentation and papers; synthetic arithmetic is author-derived. This is a targeted source review, not a verified review of Google's top ten results and not a claim of ranking superiority.
- S1: highfrequency — HARmodel estimator documentation — accessed 2026-09-10. Rolling official documentation snapshot; exact package versions used for numerical comparisons are recorded in the repair numeric-evidence.json. Supports the definition and declared convention, not investment performance. Jurisdiction: not applicable to this mathematical reference.
Scope of evidence
Level HAR with fixed 1/5/22 observed-session horizons, first ready index21. Nonnegative input RV. Signed coefficients allowed; negative raw forecasts are returned but usable forecast withheld.
Historical case: deferred. No public provider dataset, historical performance claim, or personal trading anecdote is used. Synthetic examples demonstrate arithmetic, not market efficacy. Sources are not copied as article prose.
Accessed: 2026-09-10.
Supports: estimator definition and the explicitly declared variants.
Limitations: technical documentation does not verify a real market feed, author experience, forecast efficacy or search-result superiority. Original-paper access limitations are recorded in the repair report.
Full dependency-light reference implementations in both supported languages.
/** Standalone D10-F03-A06 reference. Generated from validated D10 v2 source. */
export class ContractError extends Error {}
type RecordValue=Record<string, any>;
type Matrix=number[][];
const sum=(x:number[]):number=>x.reduce((a,b)=>a+b,0);


function requireValue(ok: unknown, code: string, message: string): asserts ok {
  if (!ok) throw new ContractError(`${code}: ${message}`);
}

function finite(x: unknown, name: string): number {
  requireValue(typeof x === 'number' && Number.isFinite(x), 'NUMBER', `${name} must be a finite number`);
  return x;
}

function param(p: RecordValue, key: string, fallback: number): number {
  return finite(Object.hasOwn(p, key) ? p[key] : fallback, key);
}

function vector(value: unknown, name: string, minimum = 1): number[] {
  requireValue(Array.isArray(value) && value.length >= minimum, 'SHAPE', `${name} needs ${minimum} or more values`);
  return value.map((v, i) => finite(v, `${name}[${i}]`));
}

function seriesResult(series: (RecordValue | null)[], diagnostics: RecordValue): RecordValue {
  const at = series.findIndex(v => v !== null);
  return {series, latest: series.at(-1) ?? null, ready: series.length > 0 && series.at(-1) !== null,
    ready_at: at < 0 ? null : at, diagnostics};
}

function har(data: RecordValue, p: RecordValue): RecordValue {
  const rv = vector(data.realized_variance, 'realized_variance');
  requireValue(Math.min(...rv) >= 0, 'RANGE', 'realized_variance must be nonnegative');
  const b0 = param(p, 'beta0', 0), bd = param(p, 'beta_daily', .45), bw = param(p, 'beta_weekly', .35), bm = param(p, 'beta_monthly', .15);
  const series = rv.map((daily, i) => {
    if (i < 21) return null;
    const weekly = sum(rv.slice(i - 4, i + 1)) / 5, monthly = sum(rv.slice(i - 21, i + 1)) / 22;
    const terms = [b0, bd * daily, bw * weekly, bm * monthly], raw = sum(terms);
    return {index: i, forecast_index: i + 1, forecast_raw: raw, forecast: raw >= 0 ? raw : null, valid: raw >= 0, daily, weekly, monthly, contributions: terms, baseline: daily};
  });
  return seriesResult(series, {causal: true, input_count: rv.length, fitted_parameters: false});
}
export function calculate(data: RecordValue): RecordValue {
  requireValue(data && typeof data === 'object' && !Array.isArray(data),'SHAPE','input must be an object');
  const p=Object.hasOwn(data,'parameters')?data.parameters:{};
  requireValue(p && typeof p === 'object' && !Array.isArray(p),'SHAPE','parameters must be an object');
  const result=har(data,p);
  function check(v:any):void {
    if(typeof v==='number')requireValue(Number.isFinite(v),'NUMERIC','nonfinite computed output');
    else if(Array.isArray(v))v.forEach(check);
    else if(v && typeof v==='object')Object.values(v).forEach(check);
  }
  check(result);
  return {topic_id:"D10-F03-A06",title:"HAR-RV",parameters:p,...result};
}
The embedded lab now expands to its full document height, keeping the article as the only scroll surface.