
 By Islam Baraka
The governed definitions this build depends on. Read them first if a term is unfamiliar.
- PrimaryBollinger BandsBollinger Bands are a moving center with upper and lower bands placed at a declared multiple of rolling price dispersion.
- PrerequisiteFull-Window ReadinessFull-Window Readiness means an algorithm emits a valid value only after receiving its complete declared observation window.
- PrerequisiteMoving AverageMoving Average is a smoothing statistic recomputed or recursively updated as the observation position advances.
- PrerequisiteRolling Population Standard DeviationRolling Population Standard Deviation is the nonnegative square root of rolling population variance.
- PrerequisiteRolling Population VarianceRolling Population Variance is the mean squared deviation from the arithmetic mean inside each active window.
- ImportantBollinger Band TagBollinger Band Tag is an observation that price has reached or crossed one of the Bollinger bands.
- ImportantBollinger Confidence-Interval MisinterpretationBollinger Confidence-Interval Misinterpretation is the incorrect claim that two-standard-deviation bands automatically form a 95-percent price confidence interval.
- ImportantBollinger Full Band WidthBollinger Full Band Width is the price-unit distance between the upper and lower Bollinger bands.
- ImportantBollinger Lower BandBollinger Lower Band is the middle band minus a declared multiplier times rolling standard deviation.
- ImportantBollinger Middle BandBollinger Middle Band is the moving-average center used to position the upper and lower bands.
- ImportantBollinger Percent BBollinger Percent B locates price relative to the lower and upper Bollinger bands.
- ImportantBollinger Upper BandBollinger Upper Band is the middle band plus a declared multiplier times rolling standard deviation.
- ImportantCollapsed Bollinger BandsCollapsed Bollinger Bands occur when rolling dispersion is zero and all three bands share the same value.
- ImportantOutside-Band Percent BOutside-Band Percent B is a valid Percent B value below zero or above one when price lies beyond a Bollinger band.
- ImportantSample-versus-Population DeviationSample-versus-Population Deviation is the denominator distinction between n-minus-one and n standard-deviation calculations.
- ImportantSymmetric Deviation MultiplierSymmetric Deviation Multiplier scales one dispersion estimate equally above and below a center line.
Where is the current close relative to its rolling level and dispersion? That is the practical question behind Bollinger Bands. This tutorial builds the answer from finalized data, shows the exact arithmetic, and gives you a laboratory for breaking the indicator safely.
The mental model in one minute
This package uses the traditional close-price SMA and population standard deviation over the same 20-row window, with symmetric bands at two standard deviations.
The output is a measurement. It is not an order, forecast, confidence interval, or promise that a familiar-looking market pattern will repeat.
Contract before chart
- Variant: This package freezes close, SMA(20), population standard deviation, symmetric multiplier 2, and no display offset.
- Defaults: period=20, multiplier=2.
- First publication: index 19 after the first 20 closes.
- Data: finalized, causal observations on one price basis.
- Missing, malformed, or mixed-basis input: reject rather than repair silently.
Formula and symbols
| Symbol | Meaning | Unit |
|---|---|---|
| close inside the active window | price units | |
| n-period simple moving average | price units | |
| population standard deviation of the same n closes | price units | |
| positive band multiplier | dimensionless | |
| location between lower and upper bands | ratio |
Calculate it by hand
Use the complete four-close window [10, 12, 14, 16] and k=2.
- Mean:
(10 + 12 + 14 + 16) / 4 = 13. - Squared deviations:
9, 1, 1, 9; total20. - Population variance:
20 / 4 = 5; deviation√5 ≈ 2.236068. - Upper:
13 + 2 × 2.236068 ≈ 17.472136. - Lower:
13 - 2 × 2.236068 ≈ 8.527864. - For the current close 16,
%b ≈ (16 - 8.527864) / 8.944272 ≈ 0.835410.
Using sample deviation would divide by 3 and create wider bands. That is a different contract, not a rounding difference.
That calculation is deliberately small enough to audit without code. The 240-row fixtures then show how the same rule behaves through warm-up, regime changes, ties, gaps, shocks, and expiry.
The complete algorithm
- Take the trailing n closes including the current close.
- Compute their arithmetic mean.
- Compute population variance with denominator n, then its square root.
- Add and subtract k times that deviation from the same mean.
- Calculate %b only when upper minus lower is nonzero.
The flow exposes the point where a result becomes unavailable, where recursive state begins, or where a rolling owner expires.
See the mechanism
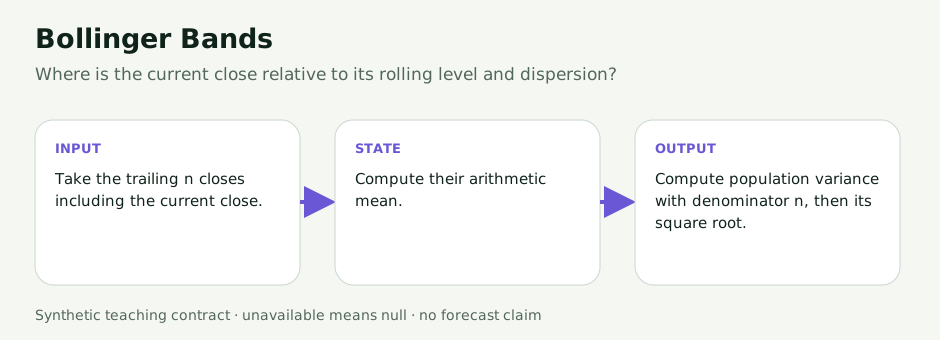
The map connects formula terms to the exact data they consume.
Follow a complete causal trace
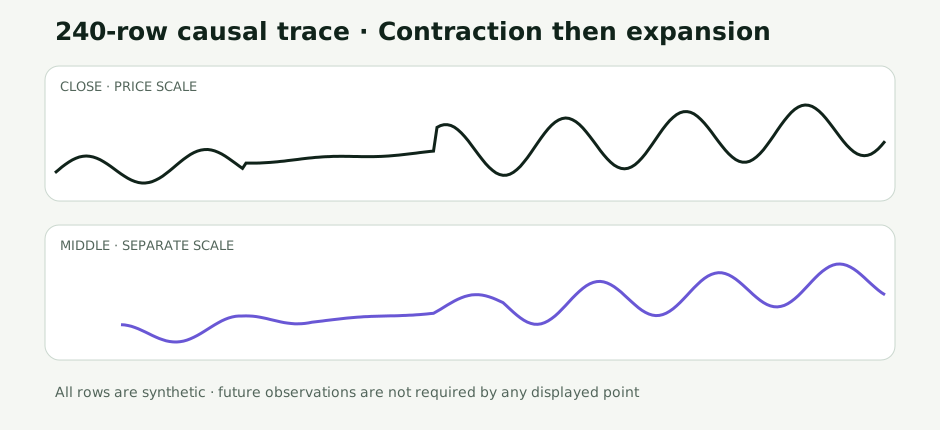
Only rows at or before the active observation may influence the displayed state. Warm-up is shown as unavailable rather than silently converted to zero.
Memory is part of the definition
Finite n-row window. An outlier changes mean and dispersion immediately, then can cause an abrupt width change when it leaves the back of the window.
Band width equals 2kσ. %b may be below 0 or above 1. A zero-variance window collapses all bands and makes %b undefined.
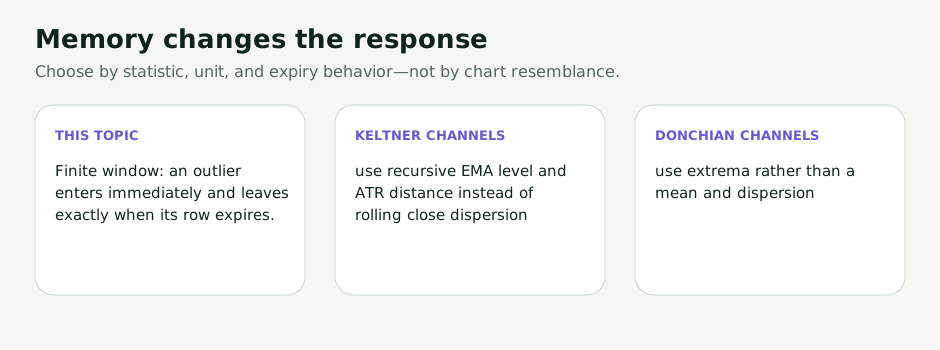
This is why two indicators can react differently to the same shock even when their plotted bands appear similar.
Six ways to try to break it
| Scenario | Teaching job | Expected lesson |
|---|---|---|
contraction-expansion | Contraction then expansion | Population dispersion narrows, then widens. |
band-walk | Trending band walk | Repeated upper-band proximity does not imply reversal. |
population-audit | Population versus sample audit | The denominator is n, not n minus one. |
zero-variance | Zero-variance window | Bands collapse and percent-b is unavailable. |
outlier-expiry | Single-outlier entry and expiry | A one-row outlier widens the finite window, then leaves it abruptly twenty rows later. |
responsive | Responsive 10 × 1.5 bands | Shorter, narrower settings react faster. |
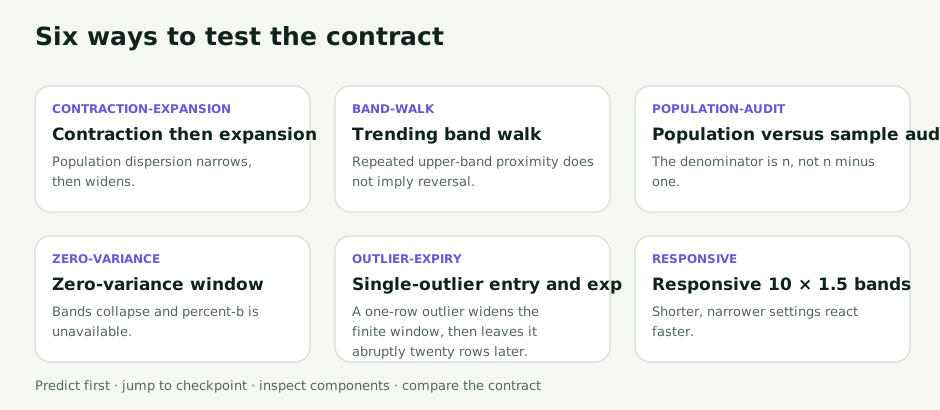
Predict the active component before opening the lab. Then jump to the relevant checkpoint and inspect the formula trace rather than guessing from line shape.
Interactive laboratory
Open the Bollinger Bands guided lab. It contains six 240-row scenarios. Change the period or multiplier where the formula exposes one; the lab recomputes immediately, stops playback, resets to an informative state, and preserves the same calculation path used by Step. Use the checkpoint selector to compare first publication, mechanism, boundary, memory, platform reconciliation, and mature state.
Production implementation
The Python and
TypeScript references
are topic-scoped and intentionally readable. They validate before calculating,
return aligned arrays, and use None/null for unavailable states. Shared
fixtures establish parity; independent family checks establish properties
without trusting either implementation as the oracle.
When production output disagrees with a chart, log:
- symbol and source ownership;
- timeframe, session, timestamp, and bar finality;
- adjustment basis;
- parameter values and first-ready index;
- the earliest divergent component;
- window inclusion, seed, denominator, multiplier, equality, and null policy;
- the earliest revised observation.
Compare, do not conflate
| Nearby topic | What changes |
|---|---|
| Keltner Channels | use recursive EMA level and ATR distance instead of rolling close dispersion. |
| Donchian Channels | use extrema rather than a mean and dispersion. |
| BandWidth | normalizes this absolute band width by the middle band. |
Misuse boundary
- Do not: Treating two standard deviations as a 95% confidence interval for prices.
- Do not: Treating an upper-band tag as an automatic sell or a lower-band tag as an automatic buy.
- Do not: Mixing sample and population deviation or using different windows for mean and deviation.
The synthetic examples establish implementation behavior only. No historical association, transaction cost, out-of-sample result, or investment suitability claim is made.
Historical example decision
No named historical episode is used. The mechanism is learned more cleanly from controlled synthetic paths, and a named case would require point-in-time, licensed, adjustment-consistent OHLC evidence before publication.
Summary
You can now state the precise question Bollinger Bands answers, calculate it, explain its memory, diagnose a platform mismatch, and separate a measurement from a trading claim. Use the family comparison rather than chart resemblance to choose the next concept.
Primary evidence
See the topic reference ledger for source roles, dates, and limitations.
Rendered from the canonical Mermaid sources linked by this article.
Bollinger Bands calculation flow
Purpose: show the exact selected state, readiness branch, and output.
Takeaway: the formula, memory, and unavailable state are part of the contract, not chart formatting.
ReferencesPrimary sources and evidence notesExpand the source trail, evidence role, and limitations behind the engineering choices.
Expand the source trail, evidence role, and limitations behind the engineering choices.
Bollinger Bands Rules
- Organization or authors: John Bollinger
- Source type: Creator-maintained guidance
- Publication, version, or access date: site current at access 2026-07-26
- URL or identifier: Bollinger Bands Rules
- Accessed: 2026-07-26
- Jurisdiction: not jurisdiction-specific
- Evidence role: sourced definition, maintained implementation, or bounded historical context
- Supports: Supports default-versus-universal distinctions, band-tag warnings, traditional SMA consistency, non-normality warning, %b, and BandWidth relationships.
- Limitations: Interpretive guidance is not evidence of prediction or profitability.
Bollinger Bands (BB)
- Organization or authors: TradingView
- Source type: Maintained platform documentation
- Publication, version, or access date: accessed 2026-07-26
- URL or identifier: Bollinger Bands (BB)
- Accessed: 2026-07-26
- Jurisdiction: not jurisdiction-specific
- Evidence role: sourced definition, maintained implementation, or bounded historical context
- Supports: Documents the common 20-period SMA and two-deviation presentation and configurable inputs.
- Limitations: Platform behavior is not a universal mathematical standard.
BBANDS — Bollinger Bands
- Organization or authors: TA-Lib
- Source type: Maintained official documentation
- Publication, version, or access date: maintained; accessed 2026-07-26
- URL or identifier: BBANDS — Bollinger Bands
- Accessed: 2026-07-26
- Jurisdiction: not jurisdiction-specific
- Evidence role: sourced definition, maintained implementation, or bounded historical context
- Supports: Supports the moving-average and standard-deviation band structure.
- Limitations: TA-Lib supports middle-band variants beyond this package’s SMA.
ta_BBANDS.c
- Organization or authors: TA-Lib
- Source type: Maintained reference implementation
- Publication, version, or access date: main branch; accessed 2026-07-26
- URL or identifier: ta_BBANDS.c
- Accessed: 2026-07-26
- Jurisdiction: not jurisdiction-specific
- Evidence role: sourced definition, maintained implementation, or bounded historical context
- Supports: Supports executable band construction and deviation handling.
- Limitations: Library configuration is broader than the frozen lesson variant.
e-Handbook: Measures of Scale
- Organization or authors: NIST/SEMATECH
- Source type: Government statistical reference
- Publication, version, or access date: accessed 2026-07-26
- URL or identifier: e-Handbook: Measures of Scale
- Accessed: 2026-07-26
- Jurisdiction: not jurisdiction-specific
- Evidence role: sourced definition, maintained implementation, or bounded historical context
- Supports: Distinguishes standard deviation as a scale measure and supplies statistical context.
- Limitations: It does not define a financial indicator or validate trading interpretations.
Public evidence boundary
The fixture is author-generated synthetic teaching material. Every displayed number is an author-derived calculation from those inputs. No provider observation, historical return, causal claim, forecast, or profitability result is published. Platform documentation supports only the named platform convention; local seeds, nulls, equality, and scope remain implementation choices.
Full dependency-light reference implementations in both supported languages.
function finite(v:number[],n:string){if(!Array.isArray(v)||!v.length||v.some(x=>!Number.isFinite(x)))throw new Error(`${n} must contain finite numbers`)}
function hlc(h:number[],l:number[],c:number[]){finite(h,"high");finite(l,"low");finite(c,"close");if(h.length!==l.length||h.length!==c.length)throw new Error("high, low, and close lengths must match");if(h.some((x,i)=>x<l[i]||c[i]<l[i]||c[i]>x))throw new Error("each bar requires low <= close <= high")}


function period(v:number,n="period"){if(!Number.isInteger(v)||v<1)throw new Error(`${n} must be a positive integer`)}

function rolling(close:number[],p:number){period(p);finite(close,"close");const middle:(number|null)[]=Array(close.length).fill(null),stddev:(number|null)[]=Array(close.length).fill(null);for(let i=p-1;i<close.length;i++){const w=close.slice(i-p+1,i+1),m=w.reduce((a,b)=>a+b,0)/p;middle[i]=m;stddev[i]=Math.sqrt(w.reduce((a,b)=>a+(b-m)**2,0)/p)}return{middle,stddev}}
export function bollingerBands(close:number[],p=20,multiplier=2){if(!Number.isFinite(multiplier)||multiplier<=0)throw new Error("multiplier must be finite and positive");const r=rolling(close,p),upper:(number|null)[]=Array(close.length).fill(null),lower:(number|null)[]=Array(close.length).fill(null),percent_b:(number|null)[]=Array(close.length).fill(null);for(let i=0;i<close.length;i++){if(r.middle[i]===null)continue;upper[i]=(r.middle[i] as number)+multiplier*(r.stddev[i] as number);lower[i]=(r.middle[i] as number)-multiplier*(r.stddev[i] as number);const width=(upper[i] as number)-(lower[i] as number);percent_b[i]=width===0?null:(close[i]-(lower[i] as number))/width}return{middle:r.middle,stddev:r.stddev,upper,lower,percent_b}}
The embedded lab now expands to its full document height, keeping the article as the only scroll surface.