
 By Islam Baraka
Make the PEG unit trap, forecast vintage, zero-growth boundary, and limited economic interpretation impossible to miss.

Figure 1. Synthetic canonical path from declared peer inputs to the selected relative-value output; the estimate is conditional, not intrinsic or predictive.
The decision this tutorial makes visible
PEG compresses price, earnings, and expected growth into one heuristic. That convenience hides the growth horizon, percentage-versus-decimal scale, sign, risk, payout, and forecast-provider assumptions.
The precise question is: How much forward P/E is being paid per percentage point of expected EPS growth under one explicit unit convention?
A practitioner needs to know what the diagnostic does and does not justify. A builder needs a contract that can be reproduced from the same point-in-time inputs in Python, TypeScript, a visual, and a browser lab.
Intuition before notation
PEG asks how many P/E turns are paid for each forecast growth point. Because the denominator is a forecast and omits risk and payout, lower is not automatically better and no universal fair PEG exists.
The result depends on the declared algorithm scope, input clocks, units, equality and rounding policies, and unsupported-state treatment. Change one of those and the output represents a different decision even when its field name is unchanged.
Scope and nearby methods
The canonical ratio is positive forward P/E divided by positive expected EPS growth expressed in percentage points, so 12% enters as 12, not 0.12. It also applies the median peer PEG to target growth only as an explicitly conditional comparable valuation.
| Variant | Definition | Best use | Main limitation |
|---|---|---|---|
| Canonical forward PEG | Forward P/E divided by positive expected EPS growth points | Growth-aware peer comparison | Omits risk and payout |
| Trailing PEG | Trailing P/E divided by historical growth | Retrospective description | Not forward-looking |
| Modified PEG/PEGY | Adds yield or other terms | Broader heuristic | Different method and calibration |
What is sourced, selected, synthetic, and derived
| Role | Material claim | Evidence | Boundary |
|---|---|---|---|
| Sourced fact | The common PEG heuristic divides P/E by short-term earnings growth and remains too simple to isolate expected return. | Easton (2004) | The paper does not set a fair PEG threshold. |
| Implementation choice | Growth is entered in percentage points. | Frozen package contract | Decimal-input systems must convert explicitly. |
| Synthetic teaching input | Target forward P/E is 24× and growth is 12 percentage points. | Repository fixture | Not a forecast. |
| Author-derived calculation | Target PEG is 2.0 and peer-implied forward P/E is 19.2×. | 24/12 and 1.6×12 | Conditional heuristic only. |
The authoritative sources support only the exact facts named in the claim ledger. They do not certify the synthetic numbers in this tutorial. The repository fixture is deliberately invented for auditability, and the displayed output is author-derived under the selected implementation choice.
Formula, symbols, and numerical policy
PEG = forward_PE / expected_growth_percentage_points; implied_forward_PE = median_peer_PEG × target_growth_percentage_points
| Symbol | Meaning | Unit | Policy |
|---|---|---|---|
| PE_f | forward P/E | turns | same forecast horizon |
| g_% | expected EPS growth | percentage points | 12 means 12% |
| PEG | growth-scaled P/E | turns per growth point | positive growth only |
| PE* | peer-implied forward P/E | turns | not an expected return |
- Use IEEE-754 binary64 arithmetic without intermediate rounding.
- Report ratios to at least four decimals and currency outputs to a declared presentation precision only after calculation.
- Use the ordinary median; for an even peer count, average the two central values.
- Keep percentage points distinct from decimals and basis points.
Read the formula in the same order as the algorithm. Validate identity, ordering, units, and supported state first. Apply the selected equality and window rules second. Calculate with unrounded numeric values. Round only at the declared presentation boundary, and preserve null as a diagnostic rather than coercing it to zero.
Build the algorithm
- Freeze forward P/E and growth horizons
- Convert the growth rate to percentage points
- Validate positive P/E and growth
- Divide forward P/E by growth points
- Compare with median peer PEG
- If forward EPS is supplied, derive a conditional implied price
Production-minded operational checklist
- Freeze valuation and knowledge-cutoff timestamps.
- Reconcile every numerator and denominator to a declared reporting basis.
- Apply eligibility rules before aggregation.
- Inspect peer dispersion and sensitivity before using a point estimate.
- Store the complete peer ledger beside the result.
The checklist is intentionally strict: an explicit rejection is safer than a plausible output built from stale, malformed, or unsupported state.
Worked synthetic example
The canonical fixture is synthetic teaching data, not an observed control
event, customer order, or broker execution. Its primary author-derived output,
target_peg_ratio, is 2.0. The complete input and output
are in datasets/canonical-input.json and datasets/expected-output.json.
The synthetic target has forward P/E 24× and expected growth 12%, entered as 12, so PEG is 2.0. Peer PEGs run from 1.2 to 2.0 with median 1.6. Applying 1.6 to 12 growth points gives 19.2×; with forward EPS of 2.50, implied price is 48.00.
Canonical peer audit table
| Synthetic peer | Forward P/E | Growth points | PEG |
|---|---|---|---|
| G1 | 18.0000× | 15.0000% | 1.2000 |
| G2 | 21.0000× | 15.0000% | 1.4000 |
| G3 | 24.0000× | 15.0000% | 1.6000 |
| G4 | 27.0000× | 15.0000% | 1.8000 |
| G5 | 30.0000× | 15.0000% | 2.0000 |
| Selected median | 1.6000 |
The table is the calculation ledger—not a market sample. Recalculate it before changing any displayed value.
Counterfactual checkpoint
100× unit trap. Entering 12% as 0.12 produces PEG 200 instead of 2 under this convention. The output changes because the denominator unit changed while the label did not
The structured result retains state and diagnostics in addition to the primary number. That makes the calculation independently reviewable and prevents a partial, null, rejected, or venue-bounded outcome from being mistaken for an unqualified value.
Boundary and counterexample workbook
The playground computes every scenario at 61 deterministic parameter states.
The table uses the declared focus step and states whether that focus reproduces
the canonical fixture. The full state ledger and compressed transition
segments are in datasets/scenario-results.json.
| Scenario | Review focus | Purpose | State | Primary output | Diagnostic | Decision segments |
|---|---|---|---|---|---|---|
| Canonical driver sweep | Step 30 · canonical fixture | Synthetic deterministic scenario; every state is recomputed from the reference algorithm. | valuation-complete | PEG 2.0000 | growth 12.0000 percentage points · peer median 1.6000 | 1 |
| Peer dispersion | Step 30 · comparison focus | Synthetic deterministic scenario; every state is recomputed from the reference algorithm. | valuation-complete | PEG 2.0000 | growth 12.0000 percentage points · peer median 1.8000 | 1 |
| Peer valuation level | Step 30 · canonical fixture | Synthetic deterministic scenario; every state is recomputed from the reference algorithm. | valuation-complete | PEG 2.0000 | growth 12.0000 percentage points · peer median 1.6000 | 1 |
| Current-price comparison | Step 30 · comparison focus | Synthetic deterministic scenario; every state is recomputed from the reference algorithm. | valuation-complete | PEG 2.0000 | growth 12.0000 percentage points · peer median 1.6000 | 1 |
| Denominator edge | Step 30 · comparison focus | Synthetic deterministic scenario; every state is recomputed from the reference algorithm. | valuation-complete | PEG 3.9834 | growth 6.0250 percentage points · peer median 1.6000 | 1 |
| Target fundamental sensitivity | Step 30 · comparison focus | Synthetic deterministic scenario; every state is recomputed from the reference algorithm. | valuation-complete | PEG 2.2917 | growth 12.0000 percentage points · peer median 1.6000 | 1 |
| Stress comparison | Step 30 · comparison focus | Synthetic deterministic scenario; every state is recomputed from the reference algorithm. | valuation-complete | PEG 3.9604 | growth 6.0600 percentage points · peer median 1.6000 | 1 |
These rows are not backtest observations. They are controlled counterexamples that expose how one driver changes the state, output, or reason code while the rest of the contract stays fixed.
Visualize the boundary
Calculation flow
The flow is deliberately gated: a failed input, eligibility, unit, or model-design check stops the value bridge instead of silently manufacturing a number.


Figure 3. Unsupported states are routed or rejected explicitly instead of being converted into a plausible-looking multiple.
Open this SVG at full size, or use the guided playground to compare the seven topic-specific canonical, boundary, policy, and failure scenarios.
The Mermaid flow answers where the selected calculation sits in the processing sequence. The SVG keeps the formula, output, decision boundary, and invariant visible together. The lab lets the reader step through the same structured states without changing the underlying definition.
Implementation walkthrough
The Python and TypeScript references begin with the same validation contract, reject malformed and unsupported state before calculation, preserve declared ordering and rounding policies, and return structured diagnostics rather than one context-free number.
The main implementation branches are:
- Growth = 0 — Reject, because Division is undefined.
- Growth < 0 — Reject or route to another method, because Negative PEG is not ordered like positive PEG.
- Growth arrives as decimal — Convert explicitly before calculation, because 0.12 versus 12 creates a 100× error.
Neither reference silently fetches data, mutates caller-owned inputs outside the declared engine behavior, guesses hidden state, or substitutes a provider default. Shared JSON fixtures make value, null, state, and reason-code drift visible across languages.
Testing and validation
Definition tests compare every canonical field, reject malformed state, and exercise the material boundary. Family validation recomputes every playground state from the reference function. Independent arithmetic is recorded beside the fixture rather than inferred only from implementation output.
The audit must preserve these invariants:
- every eligible peer's raw numerator and denominator
- each derived peer multiple
- selected aggregation statistic and dispersion
- target denominator and capital bridge
- final implied value and comparison with current price
Passing the suite proves selected-convention arithmetic and cross-language parity; it does not prove peer comparability or investment usefulness.
Failure modes and misuse
- The selected peer statistic transmits peer mispricing and normalization errors into the target estimate.
- A narrow range does not prove economic comparability; a wide range makes the point estimate fragile.
- Forward inputs are estimates with provider, vintage, horizon, and revision risk.
- Relative valuation explains a price conditional on peer pricing; it does not establish intrinsic value or future return.
Debugging order
When a result looks surprising, inspect the state in this order:
- Confirm identifiers, scope, side, and decision clock.
- Confirm units, ordering, and point-in-time inputs.
- Confirm equality, rounding, null, and reset policies.
- Recalculate the invariant and declared scenario focus before changing code.
Evidence and historical boundary
Historical decision: not useful. A named company would add filing identity, provider-price, forecast-vintage, adjustment, licensing, and hindsight questions without clarifying the arithmetic better than controlled synthetic peers. The package therefore makes no claim about any real security's fair value or future return.
The primary sources are NYU valuation portal, Damodaran relative valuation, Easton (2004). They support the source roles listed in the research ledger, not a redistributable historical observation, a private participant decision, production conformance certification, execution-quality result, profitability claim, or prediction claim.
<!-- D18-F03 additive enhancement: method-selection and continuity -->Choosing among the five relative-value methods
Use the value basis to choose the method before looking at the output label. The highlighted row is this topic's frozen contract; the other rows are nearby methods, not interchangeable fallbacks.
| Method | Value basis | Canonical driver | Rejection or routing boundary |
|---|---|---|---|
| P/E Comparable Valuation | Equity value / share | Positive EPS | Reject nonpositive EPS |
| EV/EBITDA Comparable Valuation | EV to equity bridge | Positive EBITDA | Route financial firms; reject incompatible EBITDA |
| Price-to-Book Valuation | Equity value / share | Positive common BVPS | Reject nonpositive book; no silent tangible-book swap |
| PEG Ratio | Forward P/E / growth point | Positive growth points | Reject zero/negative growth; expose 100 times unit trap |
| Peer-Multiple Regression | Conditional fitted multiple | Growth plus ROE plus leverage | Reject small/rank-deficient designs; flag extrapolation |
Interpretation ladder for PEG Ratio
- Ask: How much forward P/E is paid per percentage point of expected EPS growth?
- Verify the driver: Positive expected EPS growth in percentage points.
- Preserve the basis: Forward P/E per growth percentage point.
- Stop or route when: Reject nonpositive growth and expose percentage/decimal ambiguity.
- Carry the result forward only as conditional relative value, with its valuation date, knowledge cutoff, units, peer ledger, and diagnostic state.
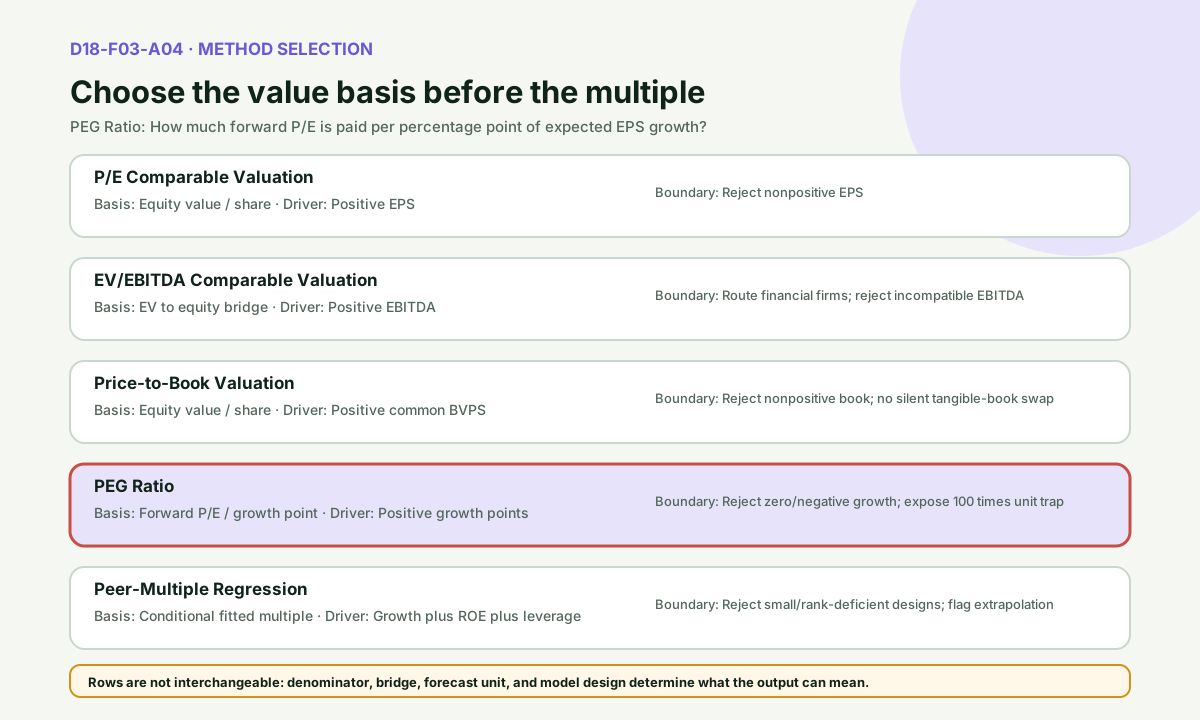
Figure 4. The highlighted contract answers this topic's question; the other rows prevent a familiar multiple from being applied to the wrong denominator or value basis.
The companion topic glossary defines governed terms and units. Continue through the family learning flow, then use the embedded playground to test the same boundary under synthetic scenarios.
Summary and next topic
You can now produce a unit-safe growth-scaled equity multiple. The learning flow is: Normalized financial statements and peer universe → PEG Ratio → Peer-Multiple Regression. Carry the result forward only with its scope, clock, state, and evidence label.
Rendered from the canonical Mermaid sources linked by this article.
PEG Ratio calculation flow
This flow identifies the selected calculation stages and the structured output.
Takeaway: PEG is a unit-sensitive forecast heuristic, not a universal growth-adjusted fair-value law.
ReferencesPrimary sources and evidence notesExpand the source trail, evidence role, and limitations behind the engineering choices.
Expand the source trail, evidence role, and limitations behind the engineering choices.
S1 — Valuation: Relative Valuation Resources
- Organization or authors: Aswath Damodaran, New York University Stern School of Business
- Source type: Authoritative academic resource index
- Publication or effective date: Accessed 2026-08-04
- Version: Current web page
- URL or DOI: https://pages.stern.nyu.edu/~adamodar/New_Home_Page/valuation/val.htm
- Accessed: 2026-08-04
- Jurisdiction: General corporate valuation
- Supports: P/E, PEG, value/EBITDA, and price/book are distinct relative-valuation multiples with distinct fundamental drivers.
- Limitations: The page is a resource index, not a standardized data contract.
S2 — Relative Valuation
- Organization or authors: Aswath Damodaran, New York University Stern School of Business
- Source type: Authoritative academic lecture material
- Publication or effective date: Current teaching deck accessed 2026-08-04
- Version: 91-page relative-valuation deck
- URL or DOI: https://people.stern.nyu.edu/adamodar/pdfiles/country/relval.pdf
- Accessed: 2026-08-04
- Jurisdiction: General corporate valuation
- Supports: A multiple must be defined consistently, compared across genuinely comparable firms, and controlled for growth, risk, and cash-flow fundamentals.
- Limitations: Does not prescribe this package's synthetic peers, median selection, or point estimate.
S3 — PE Ratios, PEG Ratios, and Estimating the Implied Expected Rate of Return on Equity Capital
- Organization or authors: Peter D. Easton
- Source type: Original peer-reviewed research
- Publication or effective date: 2004
- Version: The Accounting Review 79(1), 73-95
- URL or DOI: https://doi.org/10.2308/accr.2004.79.1.73
- Accessed: 2026-08-04
- Jurisdiction: Equity-valuation research
- Supports: The common PEG heuristic divides P/E by short-term earnings growth and remains too simple to isolate expected return without further assumptions.
- Limitations: Does not validate a universal PEG threshold or this package's synthetic growth forecasts.
Evidence boundary
Sources establish the valuation concepts, accounting or regulatory boundaries, and research context. They do not verify the synthetic fixture, select these peers, or support a return forecast.
Full dependency-light reference implementations in both supported languages.
/** Reference calculations for D18-F03 Relative Valuation. */

type Row = Record<string, unknown>;

function numberValue(name: string, value: unknown, options: {positive?: boolean; nonnegative?: boolean} = {}): number {
  if (typeof value !== "number" || !Number.isFinite(value)) throw new TypeError(`${name} must be a finite number`);
  if (options.positive && value <= 0) throw new RangeError(`${name} must be greater than zero`);
  if (options.nonnegative && value < 0) throw new RangeError(`${name} must be nonnegative`);
  return value;
}

function record(name: string, value: unknown): Row {
  if (!value || typeof value !== "object" || Array.isArray(value)) throw new TypeError(`${name} must be an object`);
  return value as Row;
}

function rows(name: string, value: unknown, minimum = 3): Row[] {
  if (!Array.isArray(value) || value.length < minimum) throw new RangeError(`${name} must contain at least ${minimum} rows`);
  const seen = new Set<string>();
  return value.map((raw, index) => {
    const item = record(`${name}[${index}]`, raw);
    if (typeof item.id !== "string" || !item.id.trim()) throw new RangeError(`${name}[${index}].id must be a nonempty string`);
    if (seen.has(item.id)) throw new RangeError(`${name} ids must be unique`);
    seen.add(item.id);
    return item;
  });
}

function median(values: number[]): number {
  const ordered = [...values].sort((a, b) => a - b);
  const middle = Math.floor(ordered.length / 2);
  return ordered.length % 2 ? ordered[middle] : (ordered[middle - 1] + ordered[middle]) / 2;
}

function summary(values: number[]): Record<string, number> {
  const ordered = [...values].sort((a, b) => a - b);
  return {minimum: ordered[0], median: median(ordered), maximum: ordered.at(-1)!, range: ordered.at(-1)! - ordered[0]};
}

function premiumDiscount(implied: number | null, current: unknown, label = "target.current_price"): number | null {
  if (implied === null || current === undefined || current === null) return null;
  return implied / numberValue(label, current, {positive: true}) - 1;
}

function peComparable(inputs: Row): Row {
  const target = record("target", inputs.target);
  const targetEps = numberValue("target.earnings_per_share", target.earnings_per_share, {positive: true});
  const peerMultiples = rows("peers", inputs.peers).map((peer, index) => {
    const price = numberValue(`peers[${index}].price`, peer.price, {positive: true});
    const eps = numberValue(`peers[${index}].earnings_per_share`, peer.earnings_per_share, {positive: true});
    return {id: peer.id, price, earnings_per_share: eps, pe_ratio: price / eps};
  });
  const multipleSummary = summary(peerMultiples.map(row => row.pe_ratio));
  const selected = multipleSummary.median;
  const implied = selected * targetEps;
  return {model: "median-positive-eps-peer-pe", peer_count: peerMultiples.length, peer_multiples: peerMultiples,
    multiple_summary: multipleSummary, selected_multiple: selected, target_earnings_per_share: targetEps,
    implied_price: implied, premium_discount_to_current: premiumDiscount(implied, target.current_price), state: "valuation-complete"};
}

function evEbitda(inputs: Row): Row {
  const target = record("target", inputs.target);
  const ebitda = numberValue("target.ebitda", target.ebitda, {positive: true});
  const shares = numberValue("target.shares_outstanding", target.shares_outstanding, {positive: true});
  const netDebt = numberValue("target.net_debt", target.net_debt ?? 0);
  const preferred = numberValue("target.preferred_equity", target.preferred_equity ?? 0, {nonnegative: true});
  const nci = numberValue("target.noncontrolling_interest", target.noncontrolling_interest ?? 0, {nonnegative: true});
  const nonoperating = numberValue("target.nonoperating_assets", target.nonoperating_assets ?? 0, {nonnegative: true});
  const peerMultiples = rows("peers", inputs.peers).map((peer, index) => {
    const enterpriseValue = numberValue(`peers[${index}].enterprise_value`, peer.enterprise_value, {positive: true});
    const peerEbitda = numberValue(`peers[${index}].ebitda`, peer.ebitda, {positive: true});
    return {id: peer.id, enterprise_value: enterpriseValue, ebitda: peerEbitda, ev_ebitda: enterpriseValue / peerEbitda};
  });
  const multipleSummary = summary(peerMultiples.map(row => row.ev_ebitda));
  const selected = multipleSummary.median;
  const impliedEnterprise = selected * ebitda;
  const impliedEquity = impliedEnterprise - netDebt - preferred - nci + nonoperating;
  const impliedPrice = impliedEquity > 0 ? impliedEquity / shares : null;
  return {model: "median-positive-ebitda-peer-ev-ebitda", peer_count: peerMultiples.length, peer_multiples: peerMultiples,
    multiple_summary: multipleSummary, selected_multiple: selected, target_ebitda: ebitda,
    implied_enterprise_value: impliedEnterprise, equity_bridge: {net_debt: netDebt, preferred_equity: preferred,
      noncontrolling_interest: nci, nonoperating_assets: nonoperating}, implied_equity_value: impliedEquity,
    shares_outstanding: shares, implied_price: impliedPrice,
    premium_discount_to_current: premiumDiscount(impliedPrice, target.current_price),
    state: impliedPrice === null ? "nonpositive-equity-bridge" : "valuation-complete"};
}

function priceToBook(inputs: Row): Row {
  const target = record("target", inputs.target);
  const targetBvps = numberValue("target.book_value_per_share", target.book_value_per_share, {positive: true});
  const peerMultiples = rows("peers", inputs.peers).map((peer, index) => {
    const price = numberValue(`peers[${index}].price`, peer.price, {positive: true});
    const bvps = numberValue(`peers[${index}].book_value_per_share`, peer.book_value_per_share, {positive: true});
    return {id: peer.id, price, book_value_per_share: bvps, price_to_book: price / bvps};
  });
  const multipleSummary = summary(peerMultiples.map(row => row.price_to_book));
  const selected = multipleSummary.median;
  const implied = selected * targetBvps;
  return {model: "median-positive-book-value-peer-pb", peer_count: peerMultiples.length, peer_multiples: peerMultiples,
    multiple_summary: multipleSummary, selected_multiple: selected, target_book_value_per_share: targetBvps,
    implied_price: implied, premium_discount_to_current: premiumDiscount(implied, target.current_price), state: "valuation-complete"};
}

function peg(inputs: Row): Row {
  const target = record("target", inputs.target);
  const forwardPe = numberValue("target.forward_pe", target.forward_pe, {positive: true});
  const growth = numberValue("target.expected_eps_growth_percent", target.expected_eps_growth_percent, {positive: true});
  const peerRatios = rows("peers", inputs.peers).map((peer, index) => {
    const peerPe = numberValue(`peers[${index}].forward_pe`, peer.forward_pe, {positive: true});
    const peerGrowth = numberValue(`peers[${index}].expected_eps_growth_percent`, peer.expected_eps_growth_percent, {positive: true});
    return {id: peer.id, forward_pe: peerPe, expected_eps_growth_percent: peerGrowth, peg_ratio: peerPe / peerGrowth};
  });
  const pegSummary = summary(peerRatios.map(row => row.peg_ratio));
  const targetPeg = forwardPe / growth;
  const impliedPe = pegSummary.median * growth;
  const forwardEps = target.forward_earnings_per_share === undefined || target.forward_earnings_per_share === null
    ? null : numberValue("target.forward_earnings_per_share", target.forward_earnings_per_share, {positive: true});
  const impliedPrice = forwardEps === null ? null : impliedPe * forwardEps;
  return {model: "forward-pe-divided-by-growth-percentage-points", growth_unit: "percentage-points",
    peer_count: peerRatios.length, peer_ratios: peerRatios, peg_summary: pegSummary, target_forward_pe: forwardPe,
    target_growth_percent: growth, target_peg_ratio: targetPeg, selected_peer_peg: pegSummary.median,
    relative_peg: targetPeg / pegSummary.median, implied_forward_pe: impliedPe,
    forward_earnings_per_share: forwardEps, implied_price: impliedPrice,
    premium_discount_to_current: premiumDiscount(impliedPrice, target.current_price),
    state: impliedPrice === null ? "ratio-only" : "valuation-complete"};
}

function solve(matrix: number[][], vector: number[]): number[] {
  const n = vector.length;
  const augmented = matrix.map((row, index) => [...row, vector[index]]);
  for (let column = 0; column < n; column += 1) {
    let pivot = column;
    for (let row = column + 1; row < n; row += 1) if (Math.abs(augmented[row][column]) > Math.abs(augmented[pivot][column])) pivot = row;
    if (Math.abs(augmented[pivot][column]) <= 1e-12) throw new RangeError("regression design matrix is rank deficient");
    [augmented[column], augmented[pivot]] = [augmented[pivot], augmented[column]];
    const scale = augmented[column][column];
    augmented[column] = augmented[column].map(value => value / scale);
    for (let row = 0; row < n; row += 1) {
      if (row === column) continue;
      const factor = augmented[row][column];
      augmented[row] = augmented[row].map((value, index) => value - factor * augmented[column][index]);
    }
  }
  return augmented.map(row => row.at(-1)!);
}

function features(name: string, row: Row): number[] {
  return [1, numberValue(`${name}.expected_growth_percent`, row.expected_growth_percent) / 100,
    numberValue(`${name}.return_on_equity_percent`, row.return_on_equity_percent) / 100,
    numberValue(`${name}.net_debt_to_ebitda`, row.net_debt_to_ebitda)];
}

function regression(inputs: Row): Row {
  const peers = rows("peers", inputs.peers, 6);
  const target = record("target", inputs.target);
  const xRows: number[][] = [];
  const y: number[] = [];
  const multiples: number[] = [];
  peers.forEach((peer, index) => {
    const multiple = numberValue(`peers[${index}].multiple`, peer.multiple, {positive: true});
    xRows.push(features(`peers[${index}]`, peer)); y.push(Math.log(multiple)); multiples.push(multiple);
  });
  const width = xRows[0].length;
  const xtx = Array.from({length: width}, (_, i) => Array.from({length: width}, (_, j) => xRows.reduce((sum, row) => sum + row[i] * row[j], 0)));
  const xty = Array.from({length: width}, (_, i) => xRows.reduce((sum, row, index) => sum + row[i] * y[index], 0));
  const beta = solve(xtx, xty);
  const fittedLogs = xRows.map(row => row.reduce((sum, value, index) => sum + value * beta[index], 0));
  const mean = y.reduce((a, b) => a + b, 0) / y.length;
  const sse = y.reduce((sum, value, index) => sum + (value - fittedLogs[index]) ** 2, 0);
  const sst = y.reduce((sum, value) => sum + (value - mean) ** 2, 0);
  const rSquared = sst === 0 ? (sse === 0 ? 1 : 0) : 1 - sse / sst;
  const fittedPeers = peers.map((peer, index) => ({id: peer.id, observed_multiple: multiples[index],
    fitted_multiple: Math.exp(fittedLogs[index]), log_residual: y[index] - fittedLogs[index]}));
  const targetX = features("target", target);
  const predictedLog = targetX.reduce((sum, value, index) => sum + value * beta[index], 0);
  const impliedMultiple = Math.exp(predictedLog);
  const metric = numberValue("target.valuation_metric", target.valuation_metric, {positive: true});
  const impliedValue = impliedMultiple * metric;
  return {model: "ols-log-multiple-on-growth-roe-and-leverage", peer_count: peers.length,
    feature_order: ["intercept", "expected_growth_decimal", "return_on_equity_decimal", "net_debt_to_ebitda"],
    coefficients: {intercept: beta[0], expected_growth_decimal: beta[1], return_on_equity_decimal: beta[2], net_debt_to_ebitda: beta[3]},
    r_squared_log_space: rSquared, fitted_peers: fittedPeers, target_predicted_log_multiple: predictedLog,
    implied_multiple: impliedMultiple, target_valuation_metric: metric, implied_value: impliedValue,
    premium_discount_to_current: premiumDiscount(impliedValue, target.current_value, "target.current_value"),
    smearing_correction: "not-applied", state: "valuation-complete"};
}

export function calculate(topicId: string, rawInputs: unknown): Row {
  const inputs = record("inputs", rawInputs);
  if (topicId === "D18-F03-A01") return peComparable(inputs);
  if (topicId === "D18-F03-A02") return evEbitda(inputs);
  if (topicId === "D18-F03-A03") return priceToBook(inputs);
  if (topicId === "D18-F03-A04") return peg(inputs);
  if (topicId === "D18-F03-A05") return regression(inputs);
  throw new RangeError(`unsupported topic_id: ${topicId}`);
}

// --- per-topic entry points
//
// One narrow export per topic. Each binds a single id and delegates to the
// dispatcher above, which still holds the arithmetic — so these change no
// behaviour and exist because a published subpath must be its own function
// rather than a shared `calculate(topicId, …)`.

/** P/E Comparable Valuation — D18-F03-A01. */
export function pEComparableValuation(rawInputs: unknown): Row {
  return calculate("D18-F03-A01", rawInputs);
}

/** EV/EBITDA Comparable Valuation — D18-F03-A02. */
export function evEbitdaComparableValuation(rawInputs: unknown): Row {
  return calculate("D18-F03-A02", rawInputs);
}

/** Price-to-Book Valuation — D18-F03-A03. */
export function priceToBookValuation(rawInputs: unknown): Row {
  return calculate("D18-F03-A03", rawInputs);
}

/** PEG Ratio — D18-F03-A04. */
export function pegRatio(rawInputs: unknown): Row {
  return calculate("D18-F03-A04", rawInputs);
}

/** Peer-Multiple Regression — D18-F03-A05. */
export function peerMultipleRegression(rawInputs: unknown): Row {
  return calculate("D18-F03-A05", rawInputs);
}
The embedded lab now expands to its full document height, keeping the article as the only scroll surface.