
 By Islam Baraka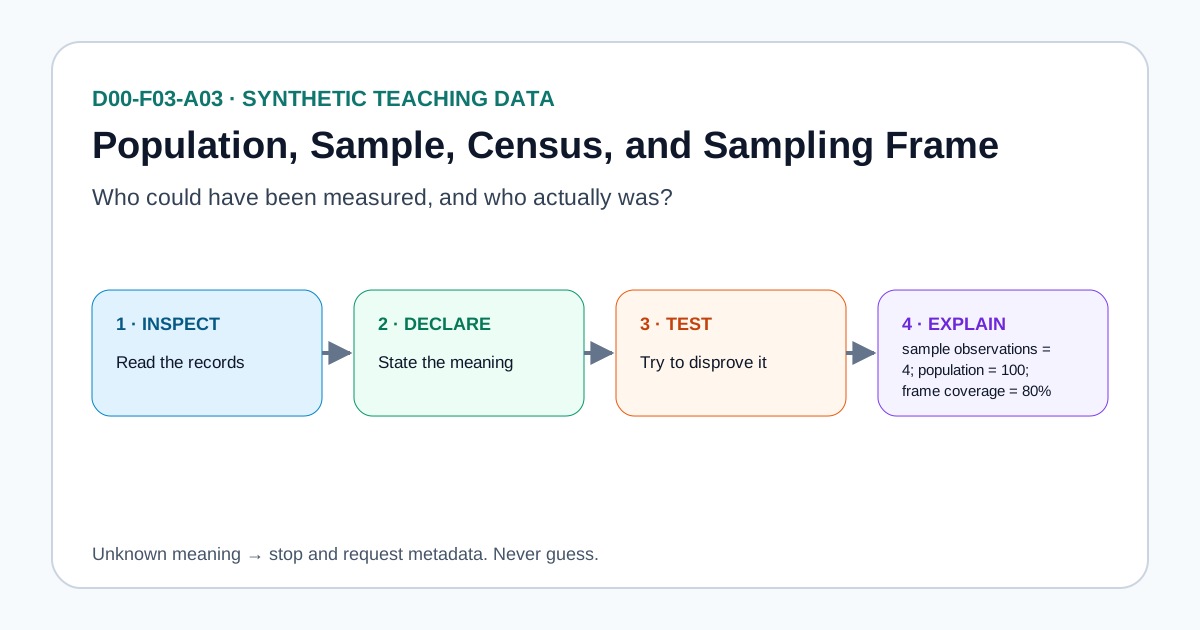
Who could have been measured, and who actually was? This sounds basic, but it is one of the most important questions in data work. A polished chart cannot rescue a dataset whose rows, fields, or time meaning were misunderstood.
The idea in one minute
The population is the full group of interest, a sample is the observed subset, a census attempts to measure every population member, and a sampling frame is the operational list from which selection occurs.
The safe rule is simple: Name the target population, frame, selection rule, and achieved sample separately. This gives you an explanation that another person can inspect instead of a hidden assumption.
A tiny synthetic example
The package uses four deliberately small records so every conclusion can be checked by eye. The teaching case records four observations for a target population of 100 and a frame of 80. The frame misses 20 population members before any sampling decision occurs.
The independent result is sample observations = 4; population = 100; frame coverage = 80%. “Synthetic” matters: these values teach the concept; they are not observations from a company, exchange, survey, or market-data provider.
Use the four-stage check
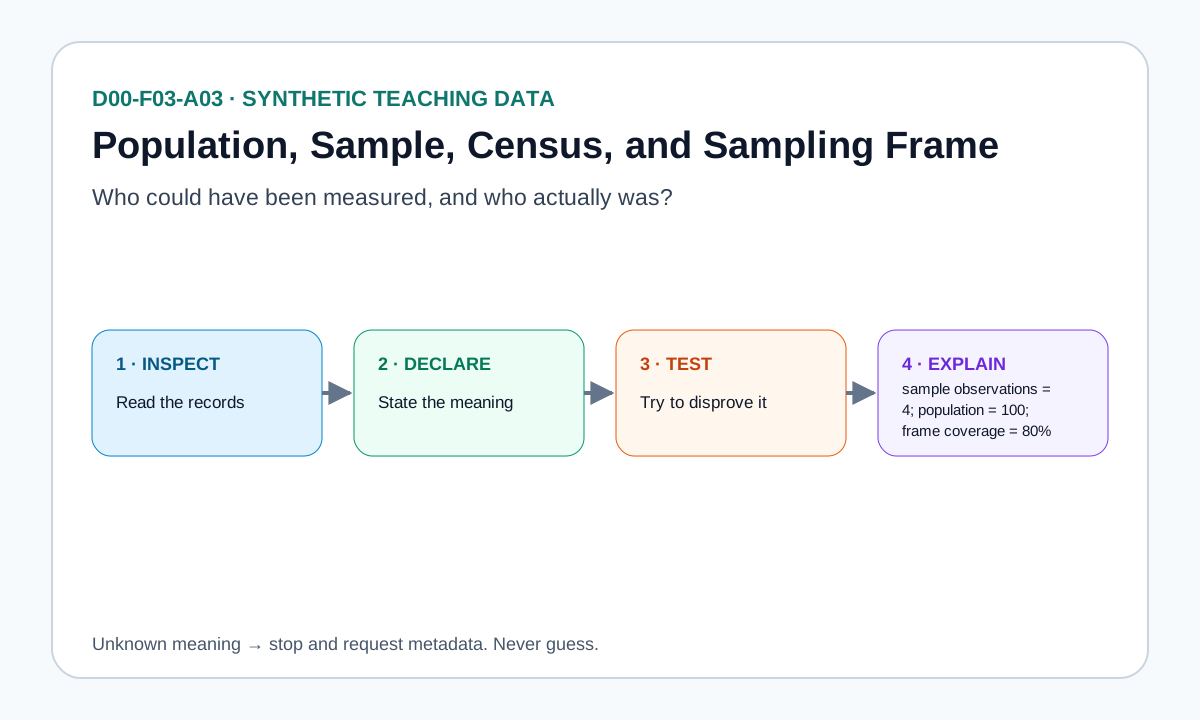
- Inspect. Read the fields and ask what one record represents.
- Declare. Write the schema, grain, time basis, or measurement meaning that the calculation depends on.
- Test. Run a small diagnostic that could expose a contradiction.
- Explain. State both the result and its boundary.
This is intentionally more careful than “load a file and calculate.” It prevents the most dangerous data errors: the ones that return reasonable-looking numbers.
The tempting mistake
Treating a convenient frame as the population hides coverage bias. The problem is semantic, so more decimal places or faster code will not fix it.
There is also an edge case: Repeated rows can make the observation count larger than the number of sampled entities. A good pipeline exposes this state to the reader. It does not quietly select a convenient interpretation.
Try the guided lab
Open the self-contained guided lab. Choose Canonical, Edge, or Failure, then use Step to move from input through declaration, diagnostic, and explanation. The lab starts with useful data, works without a server, supports keyboard controls, and has a deterministic reduced-motion mode.
What this result does not prove
The diagnostic does not prove that the source is representative, error-free, licensed for every use, or fit for an investment decision. It tells you whether the narrow assumption in this lesson survives one explicit check. Unknown metadata is a reason to abstain, not permission to guess.
Optional code verification
Python and TypeScript implementations are included for reproducibility and use the same JSON expectation. They are optional: a nontechnical learner should be able to reach the same conclusion from the table and explanation alone.
Takeaway
Name the target population, frame, selection rule, and achieved sample separately. If you can say what the input means, show the check, and name the boundary, your result is ready for the next analytical step.
Enhancement studio: draw, compare, explain
This additive studio does not replace the beginner lesson above. It gives you two more drawings, a decision comparison, and short practice prompts so you can explain the idea without copying a formula or writing code.
Drawing 1 — name, apply, check
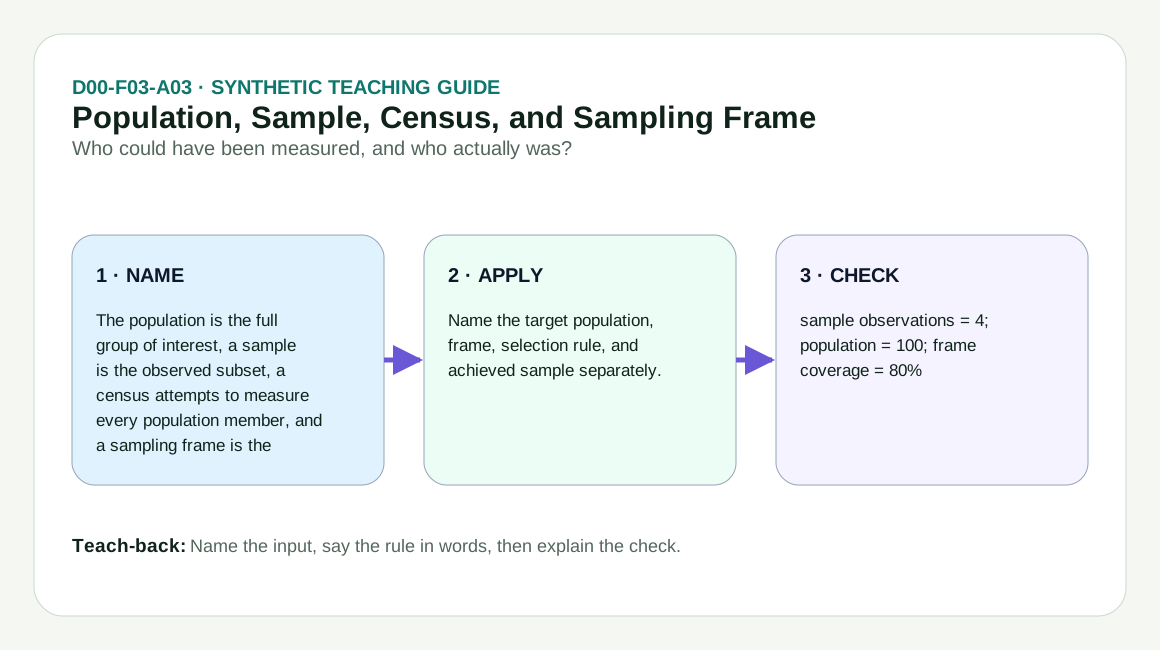
Read left to right: name what the data means, apply the narrow lesson rule, then use an independent check. Open the full-size concept anatomy.
Choose the right idea
| Decision | This lesson | Closest next or comparison | Why the difference matters |
|---|---|---|---|
| Main question | The population is the full group of interest, a sample is the observed subset, a census attempts to measure every population member, and a sampling frame is the operational list from which selection occurs. | Observations, Entities, Variables, and Datasets | Choose the question before choosing the arithmetic. |
| Safe rule | Name the target population, frame, selection rule, and achieved sample separately. | Uses its own input and boundary contract. | Neighboring lessons can use the same numbers but answer different questions. |
| Required check | sample observations = 4; population = 100; frame coverage = 80% | Re-check its own unit, time, denominator, or schema. | A correct answer to the wrong question is still wrong. |
| Stop condition | Treating a convenient frame as the population hides coverage bias. | Move only when its prerequisites are satisfied. | Unknown meaning is a reason to pause, not to guess. |
Drawing 2 — common-mistake clinic
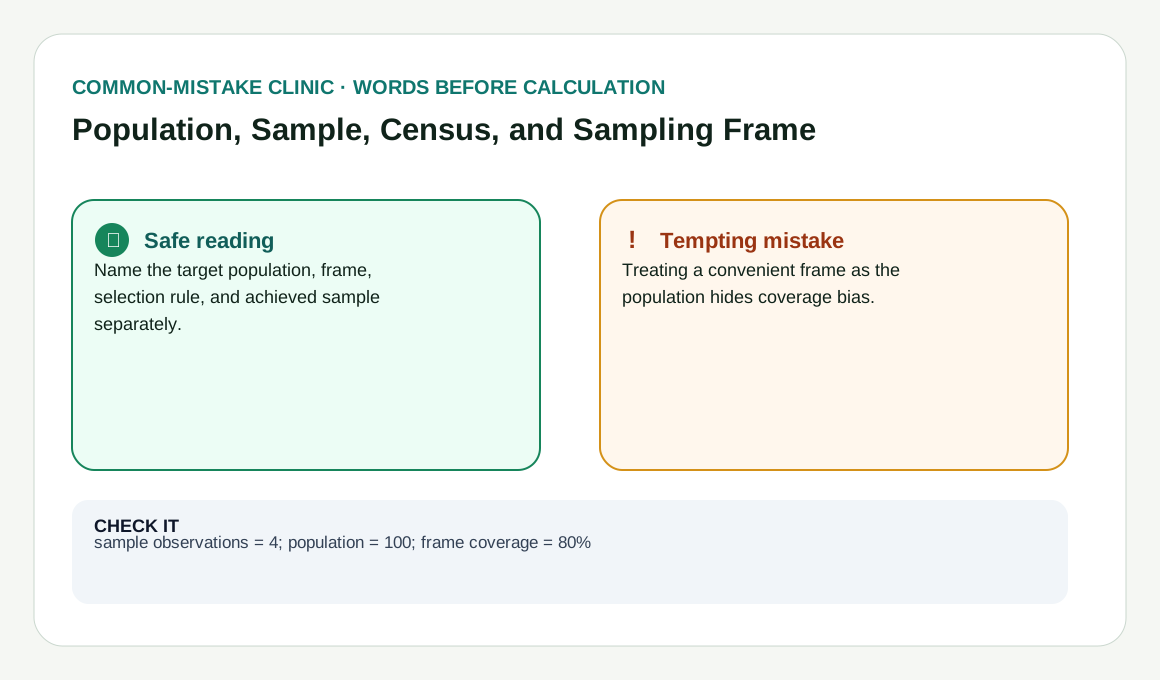
The left side states the safe interpretation; the right side shows the mistake that often produces a believable but misleading result. Open the full-size mistake comparison.
Explain it back without code
- Name it: What does the first input or observation mean?
Answer: The population is the full group of interest, a sample is the observed subset, a census attempts to measure every population member, and a sampling frame is the operational list from which selection occurs. - Choose it: Which rule belongs to this question?
Answer: Name the target population, frame, selection rule, and achieved sample separately. - Challenge it: What check could make you stop?
Answer: sample observations = 4; population = 100; frame coverage = 80%
If your explanation leaves out the unit, period, denominator, grain, or availability time that the lesson needs, it is not complete yet.
Related concepts and learning handoff
- Governed glossary: population, sample, census, sampling frame. Browse the full financial glossary when a term is unfamiliar.
- Continue with: Observations, Entities, Variables, and Datasets.
- Evidence boundary: all displayed numbers remain synthetic teaching data; the drawings do not claim a market observation, forecast, or investment result.
Rendered from the canonical Mermaid sources linked by this article.
Concept flow — D00-F03-A03
ReferencesPrimary sources and evidence notesExpand the source trail, evidence role, and limitations behind the engineering choices.
Expand the source trail, evidence role, and limitations behind the engineering choices.
The lesson uses primary standards, official statistical guidance, or official software documentation. The worked data are synthetic and author-derived.
1. U.S. Census Bureau — Sample Size Definitions
- URL: https://www.census.gov/programs-surveys/acs/methodology/sample-size-and-data-quality/sample-size-definitions.html
- Accessed: 2026-08-10
- Supports: official distinctions among population controls, samples, and survey operations.
- Limitations: Survey-specific terminology must be adapted carefully outside official statistics.
- Source role: authoritative definition or implementation reference; no numerical teaching values were copied.
2. NIST/SEMATECH e-Handbook Glossary
- URL: https://www.itl.nist.gov/div898/handbook/glossary.htm
- Accessed: 2026-08-10
- Supports: statistical definitions including population, accuracy, and precision.
- Limitations: A glossary does not prescribe a complete sampling design.
- Source role: authoritative definition or implementation reference; no numerical teaching values were copied.
Evidence boundary
The sources support definitions and operational cautions. They do not validate a particular investment decision, provider dataset, or legal interpretation. The historical-example decision is not useful for this foundations lesson: a named market dataset would add licensing and point-in-time complications without making the core distinction clearer.
Full dependency-light reference implementations in both supported languages.
import { runTopic as runD00Topic, type D00Input, type D00Output } from "../../../../shared/typescript/d00Engine.ts";

/** Run the canonical D00-F03-A03 calculation. */
export function populationSampleCensusAndSamplingFrame(input: D00Input): D00Output {
  return runD00Topic("D00-F03-A03", input);
}
The embedded lab now expands to its full document height, keeping the article as the only scroll surface.