
 By Islam Baraka
The governed definitions this build depends on. Read them first if a term is unfamiliar.
- PrimaryMoving Average Convergence DivergenceMoving Average Convergence Divergence is an oscillator family built from the difference between faster and slower exponential moving averages.
- PrerequisiteExponential Moving AverageAn Exponential Moving Average recursively gives recent observations greater influence than progressively older observations.
- PrerequisiteFast EMA PeriodFast EMA Period is the declared period or alpha parameter for MACD's more responsive EMA.
- PrerequisiteSignal EMA PeriodSignal EMA Period is the period or alpha used to smooth a MACD or PPO line into its signal line.
- PrerequisiteSlow EMA PeriodSlow EMA Period is the declared period or alpha parameter for MACD's more persistent EMA.
- PrerequisiteSmoothing ConstantA smoothing constant controls how far an exponential state moves toward each new observation.
- ImportantMACD HistogramMACD Histogram is the MACD line minus its signal line.
- ImportantMACD LineMACD Line is the fast exponential moving average minus the slow exponential moving average.
- ImportantMACD Signal LineMACD Signal Line is an exponential moving average of the MACD line.
- ImportantReady PointThe first eligible observation at which every state required for an indicator output has been initialized.
- ImportantSignal-Line CrossoverSignal-Line Crossover occurs when an oscillator moves from one side of its signal line to the other under a declared comparison rule.
- ImportantSMA-Seeded EMA InitializationAn EMA initialization policy that uses the arithmetic mean of the first eligible observations as the initial recursive state.
- ImportantSuffix RecalculationRecomputing a corrected observation and every later output whose recursive state may depend on it.
- ImportantWarm-Up PeriodThe initial span in which an indicator is accumulating enough eligible history to satisfy its declared initialization policy.
MACD is usually introduced as a bundle of crossovers: buy here, sell there, watch the bars change color. That shortcut hides the most useful idea.
MACD is a measurement system built from two spreads:
- the distance between a fast and a slow exponential moving average;
- the distance between that first spread and its own smoothed history.
Once those two distances are clear, the zero line, signal line, and histogram stop being separate pieces of chart folklore. They become simple algebra that you can calculate, test, and reason about.
This tutorial builds that understanding from the inside out. We will calculate a complete example by hand, connect every crossover to an equality, expose the two-stage warm-up, test scale behavior, and finish with production-safe implementations.
Using the tables on a narrow screen: wide tables scroll horizontally inside their own table frame. Swipe within the table to inspect later columns; the article page itself should remain fixed.
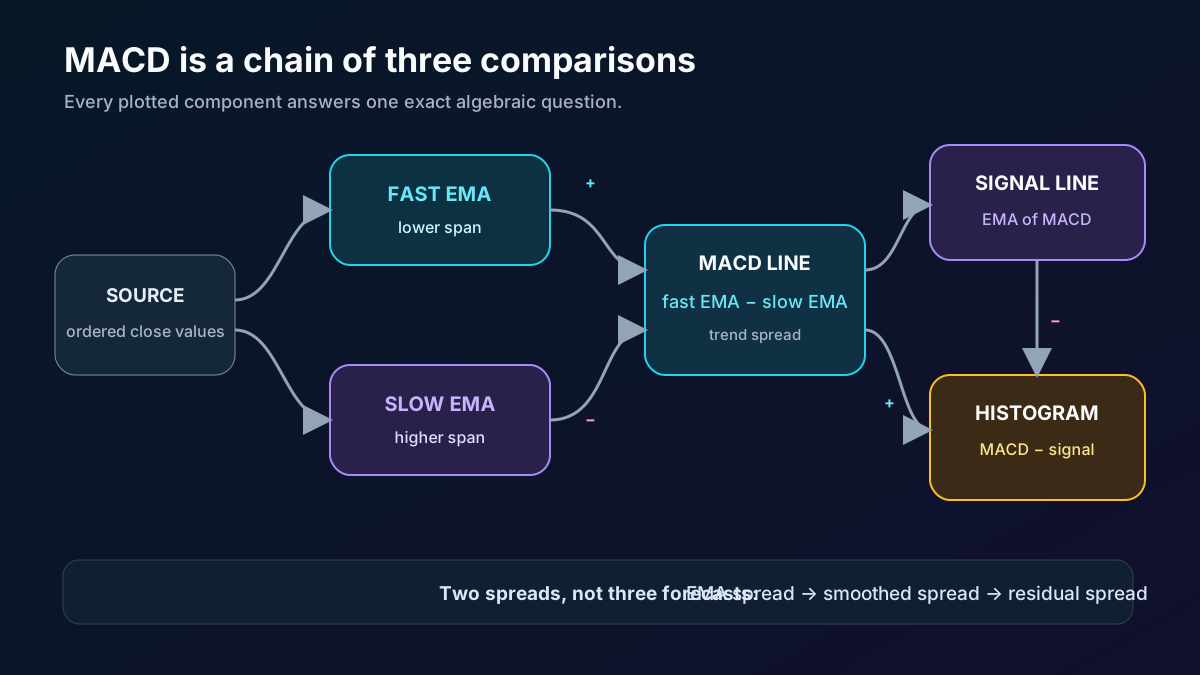
The three outputs answer three different questions
Let be the fast EMA and the slow EMA.
The MACD line asks:
Is the shorter-horizon average above or below the longer-horizon average, and by how much?
Now smooth the MACD line with another EMA:
The signal line asks:
What is the recent smoothed level of the fast-minus-slow spread?
Finally:
The histogram asks:
Is the current spread above or below its own smoothed history, and by how much?
| Component | Exact calculation | Unit | Positive means | Zero means |
|---|---|---|---|---|
| Fast EMA | EMA of source with lower span | source unit | not a signed output | not special |
| Slow EMA | EMA of source with higher span | source unit | not a signed output | not special |
| MACD | fast EMA − slow EMA | source unit | fast EMA above slow EMA | the two EMAs are equal |
| Signal | EMA of defined MACD values | source unit | smoothed spread is above zero | smoothed spread is zero |
| Histogram | MACD − signal | source unit | MACD above signal | MACD and signal are equal |
The word “momentum” is often attached to these outputs. That can be a useful interpretation, but the equations give a narrower and safer statement: MACD measures relationships among recursively smoothed levels. It does not directly measure return, velocity, acceleration, probability, or expected profit.
First visual key: the sign is just the EMA gap
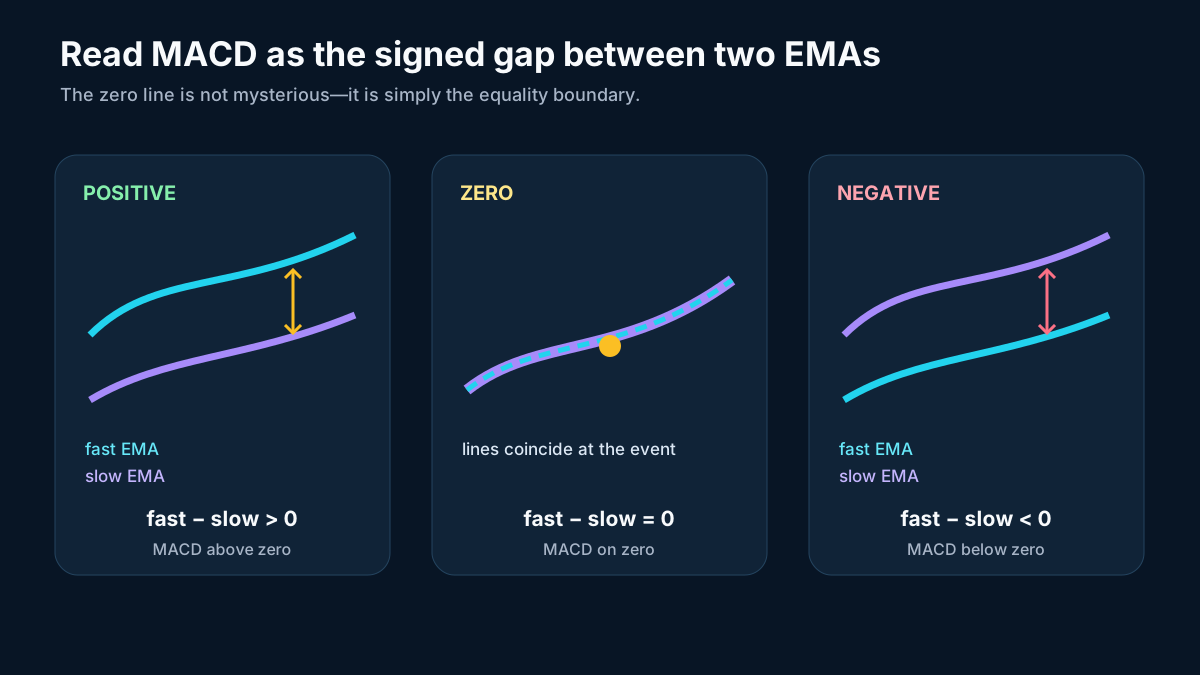
This identity is exact:
So “MACD crossed zero” and “the fast EMA crossed the slow EMA” are not two confirmations. They are two drawings of the same event.
That distinction matters. Counting the same equality twice can create false confidence. A dashboard that shows both a moving-average crossover badge and a MACD-zero-cross badge may be presenting duplicate information, not independent evidence.
The EMA convention must be named
“Use a 12-period EMA” is not yet a complete computational specification. An EMA needs both a recurrence and an initial value.
For span , this package uses:
The first defined EMA is the simple mean of the first observations:
Every later value is:
This is the classic SMA-seeded recursive convention. The fast and slow EMAs are seeded independently from the source. The signal EMA is then seeded from the first signal_span defined MACD values.
| Choice | This package | A material alternative | Consequence |
|---|---|---|---|
| EMA coefficient | 2/(span+1) | fixed default coefficients | slightly different recursive path |
| Price-EMA seed | SMA of first span source values | first source value | early output differs |
| Signal seed | SMA of first signal-span MACD values | first MACD value | early signal and bars differ |
| Output alignment | preserve every source row | return only complete rows | index mapping differs |
| Reversed spans | reject | silently swap | configuration mistakes can be hidden |
| Missing value | reject | skip, fill, or reset | state and elapsed-time meaning differ |
When two charting packages disagree near the beginning of a series, compare these choices before assuming that either one has an arithmetic bug.
Fix the timestamp and price basis before calculating
The numeric kernel receives only an ordered array, so it cannot discover whether two adjacent values are daily closes, five-minute bar closes, mixed sessions, or differently adjusted prices. The caller must attach a unique timestamp to every value and document:
- time zone and whether a bar timestamp denotes its opening or closing instant;
- frequency, trading calendar, and the treatment of missing sessions or bars;
- instrument identifier, currency, and source field;
- adjusted or unadjusted price basis and the upstream corporate-action policy;
- finalized versus provisional status.
Use one convention for the entire series. Splicing adjusted history into an unadjusted suffix can create a discontinuity that both EMAs faithfully process even though the discontinuity came from data construction rather than the market path. Likewise, a provisional latest bar can change before finalization and recursively change its MACD row.
Two warm-ups, not one
The slow EMA controls when MACD first exists. Then the signal needs its own history of MACD values.
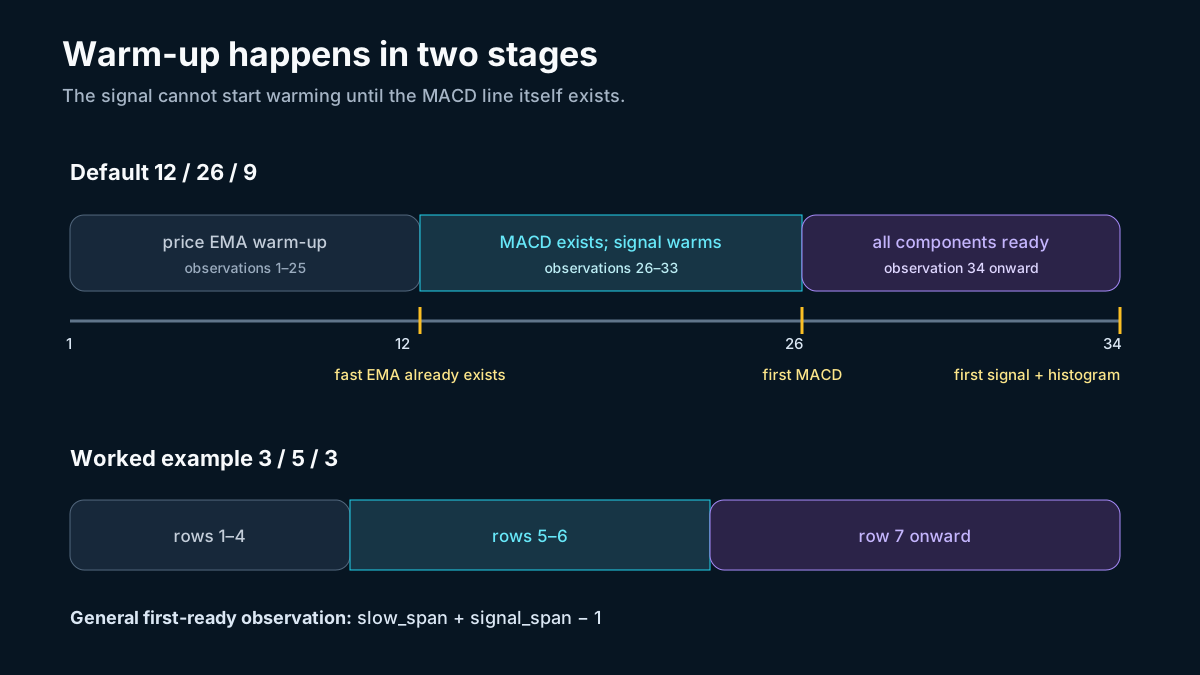
Counting observations from one:
| Milestone | Formula | Default 12/26/9 | Worked 3/5/3 |
|---|---|---|---|
| First fast EMA | fast_span | 12 | 3 |
| First slow EMA | slow_span | 26 | 5 |
| First MACD | slow_span | 26 | 5 |
| First signal | slow_span + signal_span − 1 | 34 | 7 |
| First histogram | slow_span + signal_span − 1 | 34 | 7 |
Before observation 26 in the default case, there is no canonical slow EMA under this seed convention, so there is no MACD. At observations 26 through 33, MACD exists but the nine-period signal is still accumulating its seed. Observation 34 is the first row with all three plotted outputs.
Returning those stages explicitly is safer than dropping rows. An aligned result can attach each component to the exact source timestamp and label its state:
| State | MACD | Signal | Histogram |
|---|---|---|---|
warming_price_emas | unavailable | unavailable | unavailable |
warming_signal | available | unavailable | unavailable |
ready | available | available | available |
Unavailable is represented by None or null. It is never represented by zero, because zero is a meaningful equality.
A complete 3/5/3 worked example
Short spans make every step visible. Use:
- fast span , so ;
- slow span , so ;
- signal span , so .
The synthetic source is:
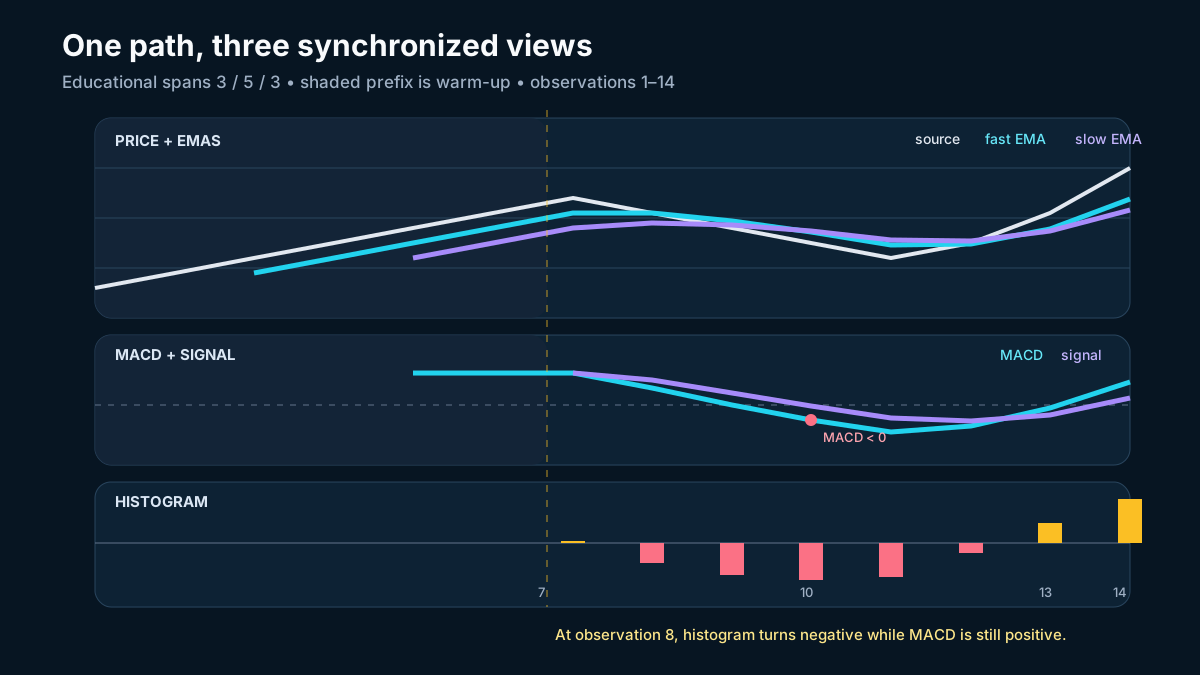
10, 11, 12, 13, 14, 15, 16, 15, 14, 13, 12, 13, 15, 18
The path rises, reverses, and recovers. It is deliberately educational rather than representative of a particular instrument.
Step 1: seed the price EMAs
The first fast EMA occurs at observation 3:
The first slow EMA occurs at observation 5:
The fast EMA has already updated twice:
Therefore the first MACD is:
The signal is still unavailable. It needs three MACD values.
Step 2: seed the signal
At observations 5, 6, and 7, the MACD values are . Therefore:
Observation 7 is the first fully ready row.
Step 3: see why MACD and histogram can disagree in sign
At observation 8:
MACD remains positive because the fast EMA remains above the slow EMA.
But the signal updates from :
So:
The two signs now say different, perfectly compatible things:
| Observation 8 fact | Value | Exact reading |
|---|---|---|
| MACD | fast EMA remains above slow EMA | |
| Signal | recent smoothed MACD is higher than current MACD | |
| Histogram | current MACD is below its signal |
A negative histogram does not require a negative MACD. The first spread can be positive while the residual spread is negative.
Step 4: cross the zero line
At observation 10:
The negative MACD means the fast EMA is now below the slow EMA. This is not a nearby confirmation of that crossover—it is the same subtraction reaching a negative result.
Step 5: recover
At observation 13:
Both spreads are positive again in this path. That simultaneity is not a general rule. A MACD zero cross and a signal cross answer different equalities and can occur at different observations.
Full audit table
Rounded values are shown for readability; the shared fixture stores the verified path.
Mobile table cue: this eight-column audit table is intentionally preserved. Swipe left or right inside its table frame to follow the same observation across all components.
| t | source | fast EMA | slow EMA | MACD | signal | histogram | state |
|---|---|---|---|---|---|---|---|
| 1 | 10 | — | — | — | — | — | price EMAs warming |
| 2 | 11 | — | — | — | — | — | price EMAs warming |
| 3 | 12 | 11.0000 | — | — | — | — | price EMAs warming |
| 4 | 13 | 12.0000 | — | — | — | — | price EMAs warming |
| 5 | 14 | 13.0000 | 12.0000 | 1.0000 | — | — | signal warming |
| 6 | 15 | 14.0000 | 13.0000 | 1.0000 | — | — | signal warming |
| 7 | 16 | 15.0000 | 14.0000 | 1.0000 | 1.0000 | 0.0000 | ready |
| 8 | 15 | 15.0000 | 14.3333 | 0.6667 | 0.8333 | -0.1667 | ready |
| 9 | 14 | 14.5000 | 14.2222 | 0.2778 | 0.5556 | -0.2778 | ready |
| 10 | 13 | 13.7500 | 13.8148 | -0.0648 | 0.2454 | -0.3102 | ready |
| 11 | 12 | 12.8750 | 13.2099 | -0.3349 | -0.0448 | -0.2901 | ready |
| 12 | 13 | 12.9375 | 13.1399 | -0.2024 | -0.1236 | -0.0788 | ready |
| 13 | 15 | 13.9688 | 13.7599 | 0.2088 | 0.0426 | 0.1662 | ready |
| 14 | 18 | 15.9844 | 15.1733 | 0.8111 | 0.4268 | 0.3842 | ready |
Two crossover identities worth memorizing
MACD zero cross
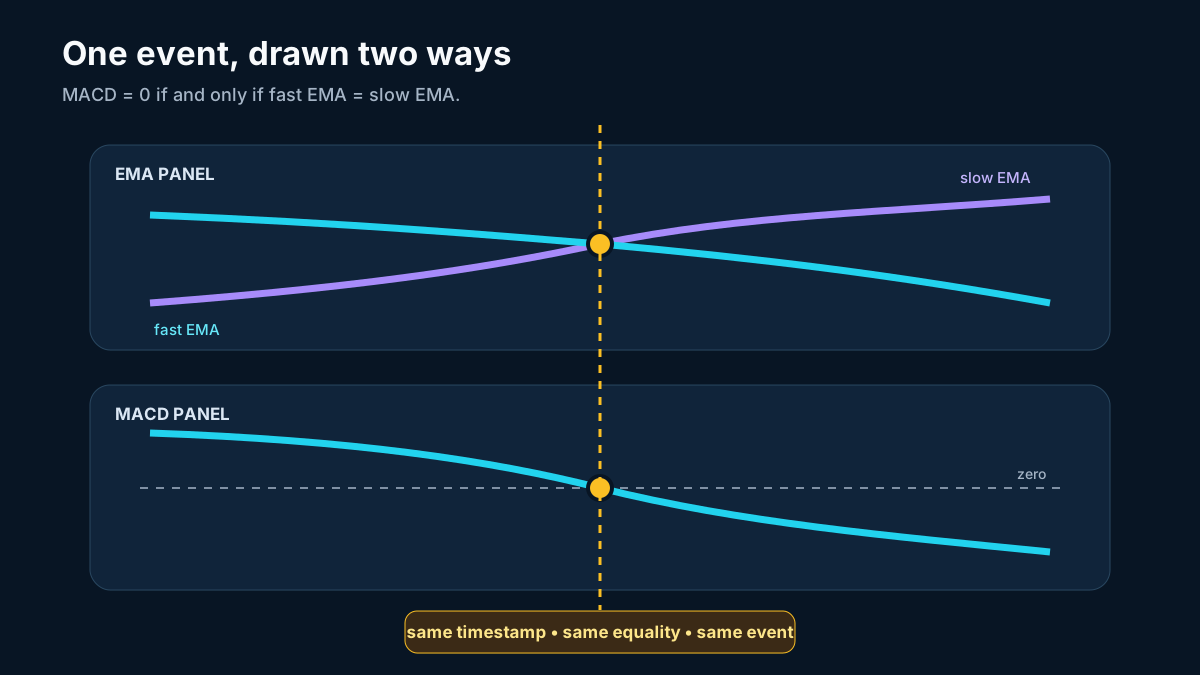
The direction of the cross is the direction of the ordering change. A cross above zero means the fast EMA moved from at-or-below the slow EMA to above it, subject to the application’s equality and numeric-tolerance policy.
Histogram zero cross
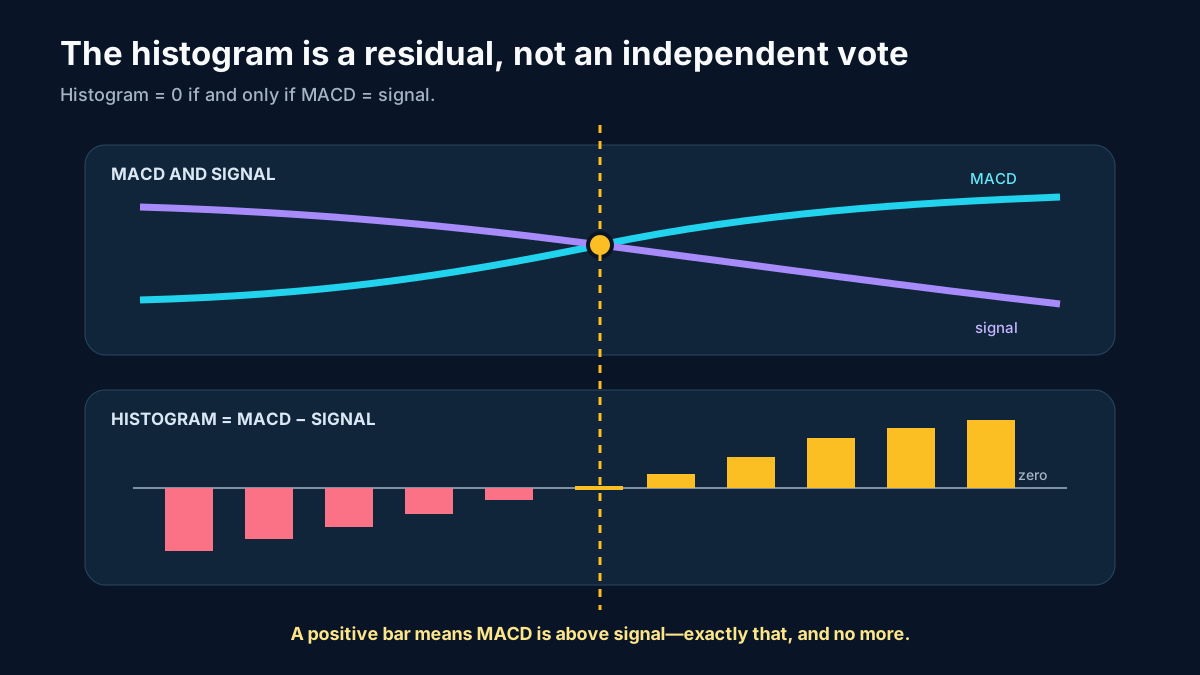
A signal-line crossover and a histogram zero cross are likewise the same event drawn as lines and bars.
For event detectors, equality needs a policy. Exact IEEE-754 equality is often too brittle for independently computed series. A separate crossover component should define:
- whether touching zero counts;
- absolute or relative tolerance;
- how repeated equal values are handled;
- whether an event is emitted intrabar or only after finalization;
- whether the first defined value can create an event.
Those are event semantics, not part of continuous MACD calculation.
Four tiny experiments that reveal the structure
1. Constant input
If every source value is , each seeded and updated price EMA is . Therefore:
This is a useful implementation test because any nonzero ready output reveals an alignment or seed defect.
2. Add a constant
Add to every source observation. Both price EMAs also increase by , so their difference is unchanged:
The signal and histogram are unchanged too. MACD is translation invariant.
3. Multiply the series
Multiply every source value by . Every linear EMA component and difference is multiplied by :
MACD is scale equivariant, not scale invariant.
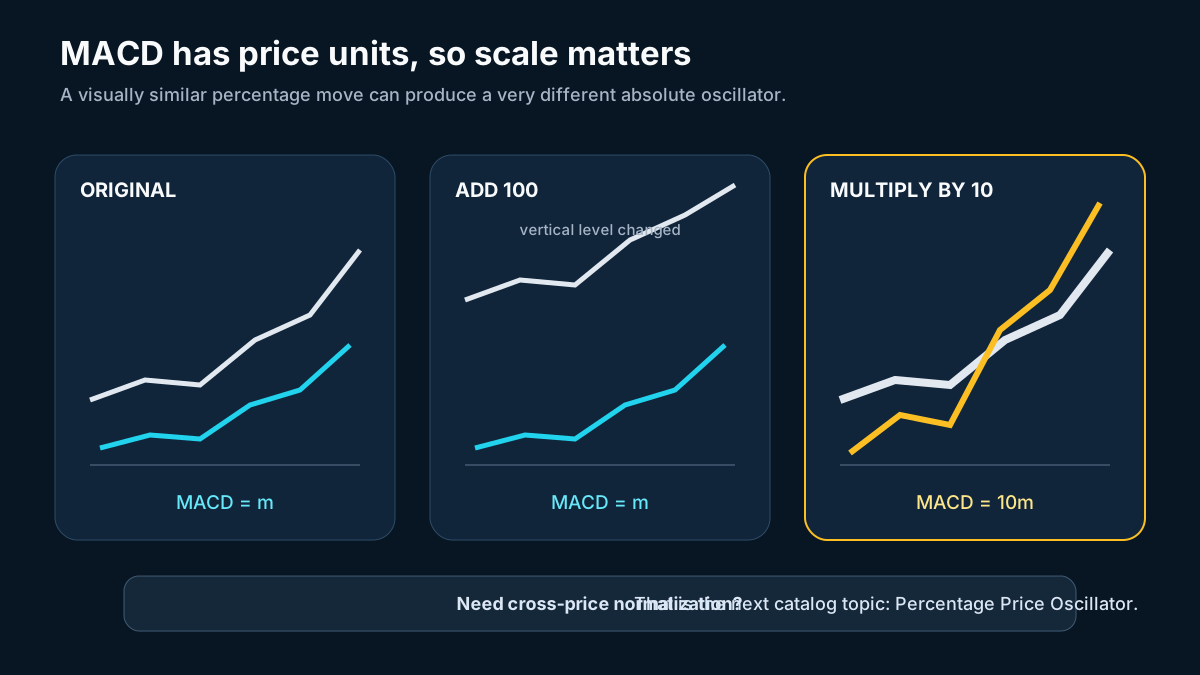
This is why “MACD is 5” has no portable meaning without the instrument’s price scale and history. The next catalog topic, Percentage Price Oscillator, addresses that normalization problem.
4. Make the signal span one
With a signal span of one, the signal EMA equals the current MACD immediately:
Therefore:
This edge case is valid and highly diagnostic. It confirms that the histogram is derived, not independent.
Why range-bound markets produce whipsaw
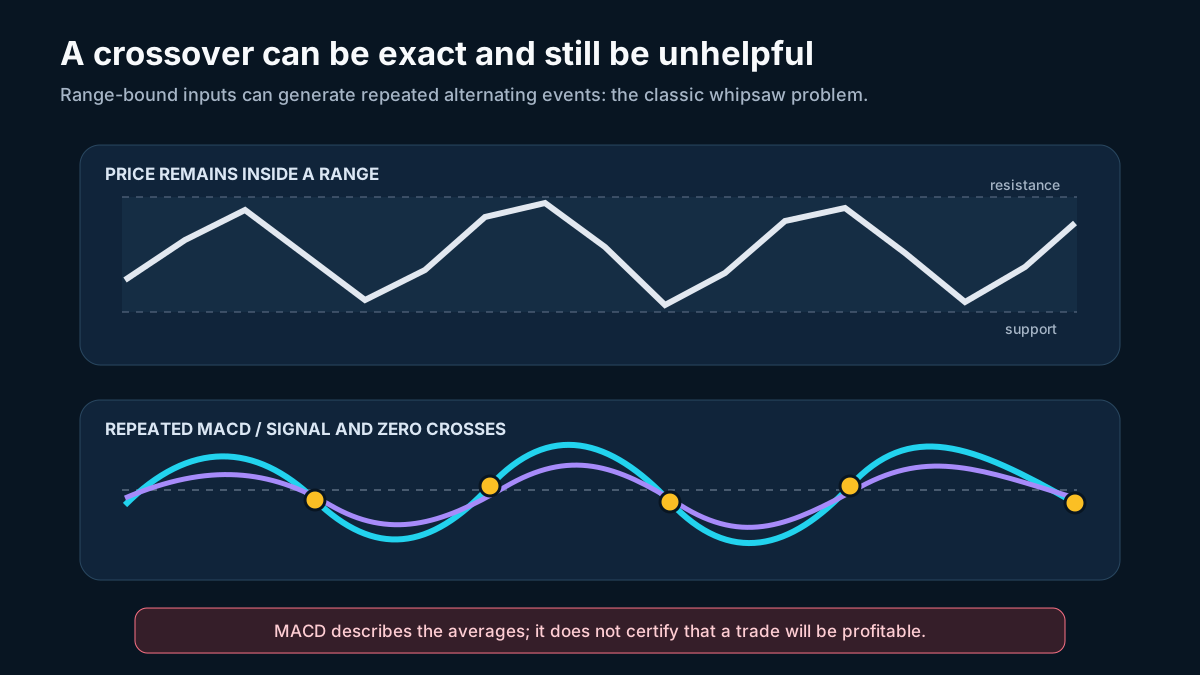
A fast EMA reacts more quickly than a slow EMA. If the source oscillates back and forth without developing a durable directional path, the fast EMA can repeatedly move above and below the slow EMA. MACD crosses zero each time. The MACD line can also repeatedly cross its signal.
Every event can be arithmetically correct while a naïve crossover strategy performs poorly after costs.
| What the event proves | What it does not prove |
|---|---|
| two averages changed ordering | the new ordering will persist |
| current MACD changed side of its signal | the next bar has the same direction |
| a signed spread reached zero | the move exceeds fees and slippage |
| recursive state responded to recent data | a structural regime changed |
| the chosen spans produced an event | those spans are suitable for the instrument |
The practical response is not to claim that MACD “fails.” It is to keep the claim boundary honest: MACD describes selected averages. Strategy quality depends on regime selection, event rules, execution timing, costs, and risk controls outside this indicator.
Use the causal lab
Open the interactive MACD causal lab.
Try this sequence:
- Keep spans at
3/5/3and step through the reversal path. - Stop at observation 5. Notice that MACD exists while signal and histogram do not.
- Stop at observation 8. Compare positive MACD with negative histogram.
- Switch to Range and whipsaw and play the complete path.
- Switch to Same shape × 10 and compare magnitudes.
- Set signal span to
1; every ready histogram bar should be zero. - Attempt fast
5, slow5; the lab rejects the ambiguous configuration.
The lab calculates only the visible prefix. Nothing at observation uses observation , so it also demonstrates causality.
Every lab scenario is synthetic. It demonstrates calculation, warm-up, scale, and whipsaw mechanics; it is not evidence that a crossover predicts a later observation or earns a return.
Implementation blueprint
The core algorithm is small:
fast = SMA-seeded EMA(source, fast_span)
slow = SMA-seeded EMA(source, slow_span)
macd = fast - slow wherever both exist
signal = SMA-seeded EMA(defined macd values, signal_span)
histogram = macd - signal wherever signal exists
return all rows in source alignment
What makes an implementation production-safe is the surrounding contract:
| Concern | Package decision |
|---|---|
| Input mutation | never mutate caller input |
| Ordering | caller supplies chronological values |
| Missing values | reject explicitly |
| Non-finite values | reject explicitly |
| Fast/slow ordering | reject fast >= slow |
| Warm-up | preserve aligned unavailable fields |
| Seed | classic SMA seed |
| Numeric type | double precision |
| Revisions | recompute affected suffix |
| Finality | caller labels provisional versus finalized |
| Complexity | linear batch; constant-time warmed append |
The Python implementation returns immutable dataclass rows. The TypeScript implementation returns typed component objects. Both read the same fixture, test algebraic identities, and test translation and scaling behavior.
Streaming state
After warm-up, a streaming system only needs:
- previous fast EMA;
- previous slow EMA;
- previous signal EMA;
- three coefficients;
- current lifecycle status.
One appended finalized observation then takes constant time:
fast   ← fast   + α_fast   × (value − fast)
slow   ← slow   + α_slow   × (value − slow)
macd   ← fast − slow
signal ← signal + α_signal × (macd − signal)
hist   ← macd − signal
During seeding, keep running sums and counts for the price EMAs and later the signal EMA. A revised historical observation is different: because the recurrence carries state forward, every later dependent value must be recomputed.
Common mistakes
| Mistake | Why it fails | Safer rule |
|---|---|---|
| Filling warm-up with zero | zero falsely claims equality | use unavailable values |
| Seeding signal from prices | signal is defined on MACD | seed from defined MACD values |
| Treating MACD and zero cross as separate evidence | they encode the same EMA ordering | count the identity once |
| Treating bars as independent evidence | histogram is MACD minus signal | interpret the residual directly |
| Comparing raw magnitudes across assets | MACD has source units | normalize or use PPO |
| Silent span swapping | hides configuration defects | reject and log |
| Skipping missing rows without a policy | changes elapsed-time meaning | reject or document reset/skip semantics |
| Using provisional bars as final | recursive suffix can change | carry finality metadata |
| Claiming prediction | moving averages react to data | state measurement, then test strategies separately |
What MACD can and cannot tell you
MACD can tell you, under a named source, span, seed, and finality convention:
- the ordering and distance of two EMAs;
- the position of that spread relative to its EMA;
- when either exact equality changes sign;
- how those measurements evolved over the observed history.
MACD alone cannot tell you:
- the probability of the next return;
- whether a crossover will persist;
- whether expected profit exceeds transaction costs;
- the correct position size;
- whether a divergence rule has valid pivots;
- whether the current observation is final;
- whether raw magnitude is comparable to another instrument.
That boundary does not make the indicator less valuable. It makes it testable.
Final mental model
When you see a MACD panel, read it in this order:
- MACD sign: Which price EMA is on top?
- MACD magnitude: How large is their gap in source units?
- Histogram sign: Is that gap above or below its own signal EMA?
- Histogram magnitude: How large is the residual?
- Lifecycle: Are all components actually warmed and finalized?
- Context: Is the source trending, ranging, scaled differently, or being revised?
Then—and only then—attach a strategy interpretation.
MACD is important not because three plotted shapes predict the future. It is important because a compact chain of recursive averages exposes trend relationships in a form that is visual, causal, and mechanically auditable.
Continue the track
Next is D07-F02-A02 — Percentage Price Oscillator. It keeps the fast-versus-slow idea but divides by the slow average, turning an absolute price-unit spread into a relative percentage spread.
For formulas, implementation-source analysis, and claim provenance, see the reference ledger.
Rendered from the canonical Mermaid sources linked by this article.
Calculation flow
The slow span controls when the MACD line first exists. The signal span adds a second, independent warm-up.
State lifecycle
Appending is causal and constant-state after warm-up. Revising history requires recomputing every dependent later row.
ReferencesPrimary sources and evidence notesExpand the source trail, evidence role, and limitations behind the engineering choices.
Expand the source trail, evidence role, and limitations behind the engineering choices.
Reviewed 2026-07-23.
- Accessed: 2026-07-23
- Limitations: Each source supports only the claims named below; none establishes predictive power, profitability, or universal cross-platform parity.
Primary and authoritative sources
-
TradingView Help Center — “Moving Average Convergence Divergence (MACD) indicator.”
https://www.tradingview.com/support/solutions/43000502344-moving-average-convergence-divergence-macd-indicator/
Source class: authoritative platform documentation.
Supports: the three defining equations; fast/slow terminology; zero line; plotted components; configurable source, lengths, and moving-average types; Gerald Appel provenance and Thomas Aspray’s later histogram addition.
Used in: formula definition, output anatomy, provenance, and variant notes. -
Fidelity Learning Center — “Moving Average Convergence/Divergence (MACD).”
https://www.fidelity.com/learning-center/trading-investing/technical-analysis/technical-indicator-guide/macd
Source class: authoritative broker education.
Supports: conventional12/26/9periods; MACD oscillating around zero; unbounded scale; parameter adjustability; susceptibility to whipsaw in trading ranges.
Used in: defaults, limitation discussion, and the range-bound example. -
TA-Lib function documentation — MACDEXT.
https://ta-lib.org/functions/macdext/
Source class: primary library documentation.
Supports: fast MA minus slow MA; signal MA of MACD; histogram residual; selectable moving-average types; signal period of one yielding a zero histogram.
Used in: formula cross-check and implementation-variant matrix. -
TA-Lib source —
ta_MACD.c.
https://github.com/TA-Lib/ta-lib/blob/main/src/ta_func/ta_MACD.c
Source class: primary implementation source.
Supports: lookback as slow EMA lookback plus signal EMA lookback; classic SMA seeding path; EMA recursive coefficients; swapping reversed fast and slow inputs; line/signal/histogram computation.
Used in: warm-up boundary, seed analysis, library comparison, and the deliberate reject-versus-swap design decision. -
TA-Lib source —
ta_EMA.c.
https://github.com/TA-Lib/ta-lib/blob/main/src/ta_func/ta_EMA.c
Source class: primary implementation source.
Supports: the classic EMA seed as the simple average of the first period and documents first-price seeding as a material compatibility alternative.
Used in: initialization contract and variant matrix. -
TradingView Help Center — “Moving averages.”
https://www.tradingview.com/support/solutions/43000502589-moving-averages/
Source class: authoritative platform documentation.
Supports: the standard EMA multiplier2/(length+1), recursive update, SMA initialization, and the fact that moving averages react to existing data rather than predict future values.
Used in: EMA formula and claim-boundary language.
Claims derived algebraically in this package
These claims do not depend on empirical market behavior:
MACD = 0if and only iffast EMA = slow EMA.histogram = 0if and only ifMACD = signal.- Adding the same constant to every input leaves MACD, signal, and histogram unchanged under the stated initialization.
- Multiplying every input by multiplies all three outputs by .
- A constant input produces zero MACD, signal, and histogram after warm-up.
- With the aligned SMA-seeded convention, first MACD is at
slow_span; first signal and histogram are atslow_span + signal_span − 1.
Each is tested in both implementation languages or by the exact-arithmetic verifier.
Historical and interpretive caution
The commonly repeated attribution to Gerald Appel and histogram addition by Thomas Aspray is retained because an authoritative platform source reports it. This package does not reproduce an original 1970s publication, and it does not assign an exact invention year beyond that sourced account.
Directional labels such as “bullish” and “bearish” are industry interpretations, not guarantees. The article therefore leads with exact ordering statements and explicitly separates them from possible market narratives.
Reproducibility
All numeric examples and visual paths are synthetic. No vendor market history is embedded. The fixture convention is:
- alpha
2/(span+1); - classic SMA seeds;
- fast span strictly less than slow span;
- aligned unavailable values represented by
null; - comparisons at
1e-9for decimal JSON and1e-12for directly derived values where appropriate.
Historical example decision
No historical market episode is published in this package. The worked path and all playground scenarios are labeled synthetic, so they support implementation verification without implying that a selected real-world interval is representative.
Before adding a historical example, archive or cite all of the following:
- authoritative or appropriately licensed provider observations with a stable instrument identifier;
- exact timestamps, time zone, session calendar, frequency, and bar-finality rule;
- source field, currency, and an explicit adjusted-or-unadjusted price convention;
- corporate-action notes covering the selected interval;
- retrieval date and a reproducible observation table;
- author-derived fast EMA, slow EMA, MACD, signal, and histogram values calculated with the package's named seed convention;
- a limitation statement that the episode illustrates measurement behavior only and does not establish causation, prediction, persistence, profitability, or investment suitability.
Provider values and author-derived indicator values must appear in separate labeled columns or sections. Credentials, private provider payloads, and redistribution-restricted data must never be included.
Full dependency-light reference implementations in both supported languages.
export type MACDStatus = "warming_price_emas" | "warming_signal" | "ready";

export interface MACDPoint {
  index: number;
  value: number;
  fastEma: number | null;
  slowEma: number | null;
  macd: number | null;
  signal: number | null;
  histogram: number | null;
  status: MACDStatus;
}

function validateSpan(name: string, value: number): void {
  if (!Number.isInteger(value) || value < 1) {
    throw new RangeError(`${name} must be a positive integer`);
  }
}

function ema(values: readonly number[], span: number): Array<number | null> {
  const result: Array<number | null> = Array(values.length).fill(null);
  if (values.length < span) return result;

  let previous = values.slice(0, span).reduce((sum, value) => sum + value, 0) / span;
  result[span - 1] = previous;
  const alpha = 2 / (span + 1);
  for (let index = span; index < values.length; index += 1) {
    previous += alpha * (values[index] - previous);
    result[index] = previous;
  }
  return result;
}

export function macd(
  values: readonly number[],
  fastSpan = 12,
  slowSpan = 26,
  signalSpan = 9,
): MACDPoint[] {
  validateSpan("fastSpan", fastSpan);
  validateSpan("slowSpan", slowSpan);
  validateSpan("signalSpan", signalSpan);
  if (fastSpan >= slowSpan) {
    throw new RangeError("fastSpan must be smaller than slowSpan");
  }
  values.forEach((value, index) => {
    if (!Number.isFinite(value)) {
      throw new TypeError(`values[${index}] must be a finite number`);
    }
  });

  const fast = ema(values, fastSpan);
  const slow = ema(values, slowSpan);
  const macdValues = values.map((_, index) => {
    const fastValue = fast[index];
    const slowValue = slow[index];
    return fastValue === null || slowValue === null ? null : fastValue - slowValue;
  });
  const compactMacd = macdValues.filter((value): value is number => value !== null);
  const compactSignal = ema(compactMacd, signalSpan);
  const signal: Array<number | null> = Array(values.length).fill(null);
  const firstMacdIndex = slowSpan - 1;
  compactSignal.forEach((value, index) => {
    signal[firstMacdIndex + index] = value;
  });

  return values.map((value, index) => {
    const macdValue = macdValues[index];
    const signalValue = signal[index];
    const histogram =
      macdValue === null || signalValue === null ? null : macdValue - signalValue;
    const status: MACDStatus =
      macdValue === null
        ? "warming_price_emas"
        : signalValue === null
          ? "warming_signal"
          : "ready";
    return {
      index,
      value,
      fastEma: fast[index],
      slowEma: slow[index],
      macd: macdValue,
      signal: signalValue,
      histogram,
      status,
    };
  });
}
The embedded lab now expands to its full document height, keeping the article as the only scroll surface.