
 By Islam Baraka
The governed definitions this build depends on. Read them first if a term is unfamiliar.
- PrimaryIchimoku CloudIchimoku Cloud is a multi-line system built from rolling high-low midpoints and deliberate plot-time displacement.
- PrerequisiteHigh-Low MidpointHigh-Low Midpoint is one half of the sum of a selected highest high and lowest low.
- PrerequisiteLookback HighLookback High is the maximum eligible observation inside a declared trailing window.
- PrerequisiteLookback LowLookback Low is the minimum eligible observation inside a declared trailing window.
- ImportantBackward Plot DisplacementBackward Plot Displacement moves a value calculated now to an earlier display coordinate while preserving its actual knowledge time.
- ImportantCausal Knowledge CutoffThe time boundary that prevents information unavailable at that moment from influencing a calculation.
- ImportantEvent TimeEvent time is the timestamp assigned to when a market or business event occurred at its source.
- ImportantForward Plot DisplacementForward Plot Displacement moves a value calculated at one observation to a later display coordinate without changing its knowledge time.
- ImportantIchimoku Base LineIchimoku Base Line is the midpoint of the highest high and lowest low over the declared medium Ichimoku window.
- ImportantIchimoku Conversion LineIchimoku Conversion Line is the midpoint of the highest high and lowest low over the declared short Ichimoku window.
- ImportantIchimoku Lagging SpanIchimoku Lagging Span is the current close displayed at an earlier chart coordinate by the declared backward displacement.
- ImportantIchimoku Leading Span AIchimoku Leading Span A is the average of the conversion and base lines calculated at the current origin and displayed forward by the declared displacement.
- ImportantIchimoku Leading Span BIchimoku Leading Span B is the midpoint of the highest high and lowest low over the declared long window, displayed forward by the cloud displacement.
- ImportantKumoKumo is the plotted region bounded by Ichimoku Leading Span A and Leading Span B.
Many implementations confuse where an Ichimoku value is calculated with where it is drawn. That mistake can turn a display convention into an accidental look-ahead feature.
Ichimoku combines rolling high-low midpoints with deliberate plotting displacement. The forward cloud contains values calculated from already observed data; the backward Chikou line is today's close drawn at an earlier chart coordinate. By the end of this tutorial, you will be able to calculate the line, audit its hidden state, reproduce its warm-up and boundary conventions, and explain why another platform can disagree.
Data note: every chart and number in this article uses deterministic synthetic teaching data. No historical return or investment-performance claim is made.
Start with the question the indicator actually answers
A trend system is useful only when its output has a precise meaning. The current package asks one bounded measurement question and refuses to turn a chart state into a forecast.
Ichimoku combines rolling high-low midpoints with deliberate plotting displacement. The forward cloud contains values calculated from already observed data; the backward Chikou line is today's close drawn at an earlier chart coordinate.

The map is the implementation checklist: validate the bar, calculate the intermediate state, apply the exact boundary rule, then publish an aligned output with its diagnostic evidence.
Formula and selected convention
Both Senkou origins are plotted at . Close is plotted as Chikou at . Projection changes the chart coordinate, not the information set used at origin time.
Defaults are teaching choices rather than universal laws:
| Parameter | Package default |
|---|---|
conversion_period | 9 |
base_period | 26 |
span_b_period | 52 |
displacement | 26 |
Worked numerical example
If Tenkan is 104 and Kijun is 100 at origin index 60, Span A is 102 and is plotted at index 86. It remains a value known at index 60, not a forecast calculated at index 86.
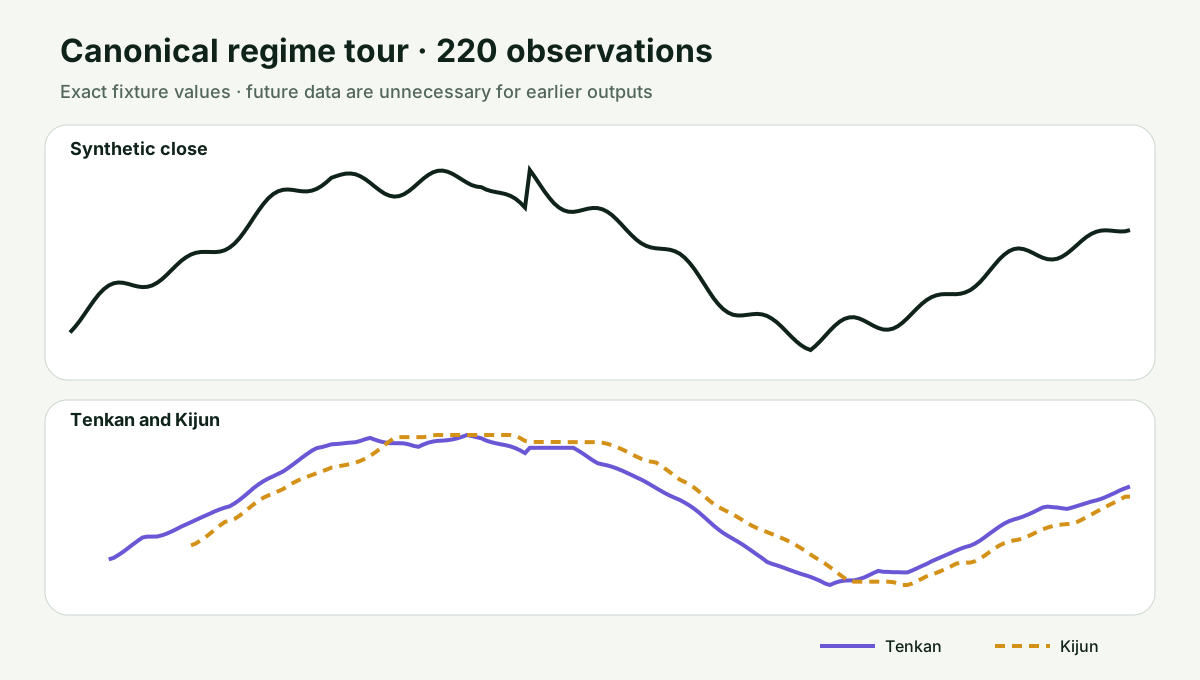
The hand result is deliberately small enough to recalculate without either implementation. The canonical fixture then extends the same rules across five long, topic-specific paths.
From data contract to executable state
Use finalized, chronological observations with one declared source field, session calendar, time zone, and adjustment basis. Reject non-finite values, malformed high/low geometry, and invalid parameters. Do not sort inside the numeric kernel, fill missing bars with zero, or splice adjusted and unadjusted history.
The implementation returns one aligned entry per input row. Warm-up stays
None in Python and null in TypeScript. A revision to historical input
invalidates the recursive or rolling suffix from the earliest changed row.
Implementation walkthrough
The Python and TypeScript files favor direct state variables over clever vectorization. That makes seed, tie, clamp, displacement, and reversal behavior reviewable. Both languages read the same fixture and preserve the same null, numeric, string, and boolean semantics.
Complexity is linear in the number of observations. The reference code is optimized for readability; a production streaming implementation can retain only the active rolling/recursive state after validating parity.
Reconcile a platform disagreement systematically
| Dimension | This package | Maintained-platform context | What to compare |
|---|---|---|---|
| Cloud values | Origin arrays stored separately | TradingView plots both leading spans forward | A plotted future coordinate is not a forecast value. |
| Lagging line | Current close drawn backward | TradingView plots close 26 periods in the past | The displayed past point was not known at that past decision time. |
| Periods | 9/26/52 with displacement 26 | 7/22/44 and other conventions exist | Version every period and plot displacement. |
Start at the first row where the two outputs diverge. Compare source fields and parameters first, then the previous intermediate state, and only then the published line. This avoids treating a documented convention difference as a numerical defect.
Explore the exact state
Open the guided Ichimoku Cloud playground. The initial state is already informative. Choose a scenario, scrub or step to a named checkpoint, compare the visible diagnostics, and inspect the last 12 published rows.
The lab uses 220 observations in each of five scenarios, not a tiny decorative sample. A recent-60, recent-120, or complete-history focus keeps the denser path readable. Reduced-motion Play advances one observation without starting a timer.
Use the five-scenario atlas
| Lesson | Scenario ID | What the controlled path isolates |
|---|---|---|
| Origin-time and plot-time map | origin-plot-clock | A 220-bar path keeps calculation indexes and displaced display indexes visible through multiple cloud regimes. |
| Cloud twist sequence | cloud-twist | Changing range midpoints cause Span A and Span B to exchange order without using future observations. |
| Flat-range equilibrium | flat-range-equilibrium | A long range shelf shows midpoint stability and why close averages are not interchangeable with high-low midpoints. |
| Zero-displacement audit | zero-displacement-audit | A display-only displacement of zero aligns origin and plot arrays, making the mapping contract directly auditable. |
| 7/22/44 convention comparison | seven-twenty-two-forty-four | A nearby 7/22/44/22 convention demonstrates why period and displacement choices must be versioned. |
Each path contains five checkpoints: first guided state, transition, boundary, platform reconciliation, and mature-state audit. These labels explain deterministic calculation state; they do not classify future market behavior.
A production debugging ladder
- Verify finalized input fields, chronological order, calendar, time zone, and adjustment basis.
- Verify parameter values and the first-ready index.
- Separate every line's origin index from its plot index; a display offset never changes the information set.
- Compare the shared fixture at the first divergent row.
- Recalculate one checkpoint independently before changing code.
- Record the convention version with every persisted output.
Boundaries that cause real implementation drift
- Tenkan and Kijun are range midpoints, not simple averages of closing prices.
- Forward plotting is not future information; backward Chikou plotting is not historically available at its display index.
- Calendar sessions, displacement counts, and custom 7/22/44 variants can change platform output.

The strongest reconciliation workflow compares the first valid index, a steady-state row, an equality boundary, a reversal or reset, and the complete aligned suffix—not merely the last visible chart point.
Compare the family question, not the chart color
ADX compresses directional separation into one strength line. Ichimoku preserves multiple price-level structures and a separate plot-time geometry.
Neighboring indicators can display a similar bullish/bearish state while measuring different inputs. Agreement is not independent confirmation when the systems reuse the same prices and smoothing primitives.
Testing proves calculation, not profitability
The release checks cover:
- all-five-scenario Python/TypeScript parity;
- exact first-ready behavior;
- invalid values and parameters;
- equality, zero, tie, displacement, clamp, or reversal semantics;
- SVG accessibility and fixture-derived values;
- deterministic playground controls and reduced motion;
- responsive reader and standalone rendering.
None of those checks estimates future returns. A strategy study would still need point-in-time constituents, execution clocks, fees, slippage, survivorship controls, and out-of-sample evaluation.
Historical-example decision
A named historical chart is not useful for this mechanism lesson. It would introduce vendor data, adjustment, identifier, session, licensing, and hindsight ambiguity without strengthening the arithmetic. The synthetic paths isolate the causal rule and can be redistributed with the package.
Common questions
Is Ichimoku Cloud a prediction?
No. It is a deterministic transformation of observed bars under the selected convention.
Can I compare values across platforms?
Only after aligning the source field, price basis, windows, seed, boundary rules, and display displacement.
What should I log in production?
Log the parameters, first-ready index, current intermediate state, input revision identifier, and the exact convention version.
What is the next tutorial?
Continue to Parabolic SAR, which changes the trend-system question and makes a different state or normalization visible.
Rendered from the canonical Mermaid sources linked by this article.
Ichimoku Cloud calculation flow
Takeaway: the displayed line is reproducible only when the hidden state and its boundary convention are preserved.
References5 primary sources and evidence notesExpand the source trail, evidence role, and limitations behind the engineering choices.
Expand the source trail, evidence role, and limitations behind the engineering choices.
Access date for web sources: 2026-07-26. Public artifacts use only deterministic synthetic data.
R1 — Goichi Hosoda's Ichimoku Kinko Hyo
- Organization or authors: Goichi Hosoda's Ichimoku Kinko Hyo
- Source type: Original or origin-attribution publication record
- Publication or effective date: See catalog record
- Version: Bibliographic record accessed 2026-07-26
- URL or DOI: https://search.worldcat.org/search?q=au%3AHosoda%2C+Goichi+Ichimoku
- Accessed: 2026-07-26
- Jurisdiction: General technical analysis; no regulatory jurisdiction
- Evidence role: Origin and historical-definition context
- Supports: Authorship/origin and the conceptual purpose of the method.
- Limitations: The public record does not by itself freeze every modern platform seed, tie, plotting, or rounding convention.
- Publication decision: Cite for origin; use maintained documentation and the package contract for executable semantics.
R2 — TradingView Ichimoku Cloud
- Organization or authors: TA-Lib project or TradingView, as identified by the linked page
- Source type: Maintained official technical documentation
- Publication or effective date: Current page
- Version: Page accessed 2026-07-26
- URL or DOI: https://www.tradingview.com/support/solutions/43000589152-ichimoku-cloud/
- Accessed: 2026-07-26
- Jurisdiction: General technical analysis; platform applicability stated in the package
- Evidence role: Formula and maintained implementation-context evidence
- Supports: Ichimoku combines rolling high-low midpoints with deliberate plotting displacement. The forward cloud contains values calculated from already observed data; the backward Chikou line is today's close drawn at an earlier chart coordinate.
- Limitations: Documentation cannot establish predictive power, profitability, or universal platform parity.
- Publication decision: Publish formula facts with the package's selected conventions visibly separated.
R3 — TradingView maintained Ichimoku calculation guide
- Organization or authors: TA-Lib project or TradingView
- Source type: Pinned maintained source or maintained calculation guide
- Publication or effective date: Repository commit or current guide
- Version: Page accessed 2026-07-26
- URL or DOI: https://www.tradingview.com/support/solutions/43000589152-ichimoku-cloud/
- Accessed: 2026-07-26
- Jurisdiction: General technical analysis
- Evidence role: Executable or platform-convention evidence
- Supports: Calculation order, forward Senkou plotting, backward Chikou plotting, and stated non-predictive limitation.
- Limitations: A maintained platform description, not a digitized edition of Hosoda's original Japanese books.
- Publication decision: Use to regression-check semantics; document intentional differences instead of implying universal equivalence.
R4 — Canonical synthetic fixture and independent arithmetic
- Organization or authors: The Fintech Builder
- Source type: Author-derived calculation from synthetic teaching inputs
- Publication or effective date: 2026-07-26
- Version: Fixture schema 2.0
- URL or DOI: datasets/ichimoku-cloud-fixtures.json
- Accessed: 2026-07-26
- Jurisdiction: Not applicable
- Evidence role: Reproducibility and Python/TypeScript parity
- Supports: Published worked values, warm-up, equality, reset, and scenario behavior.
- Limitations: Synthetic observations prove calculation behavior only; they are not market evidence.
- Publication decision: Redistributable with the package; label every use synthetic.
R5 — TradingView Pine Script built-ins documentation
- Organization or authors: TA-Lib project or TradingView
- Source type: Maintained official technical documentation
- Publication or effective date: Current page
- Version: Page accessed 2026-07-26
- URL or DOI: https://www.tradingview.com/pine-script-docs/language/built-ins/
- Accessed: 2026-07-26
- Jurisdiction: General technical analysis; platform applicability stated in the package
- Evidence role: Neighboring-function and platform-reconciliation evidence
- Supports: Maintained platform context for indicator calculations and versioned chart execution.
- Limitations: A maintained platform record documents its own convention and does not make the package convention universal.
- Publication decision: Use in the reconciliation matrix; retain package choices and intentional differences explicitly.
Full dependency-light reference implementations in both supported languages.
export type Numeric = number | null;

    function validateSeries(values: number[], name: string): void {
      if (!Array.isArray(values) || values.length === 0) throw new RangeError(`${name} must be a non-empty array`);
      if (values.some((value) => typeof value !== "number" || !Number.isFinite(value))) {
throw new TypeError(`${name} must contain only finite numbers`);
      }
    }

    function validateHL(high: number[], low: number[]): void {
      validateSeries(high, "high");
      validateSeries(low, "low");
      if (high.length !== low.length) throw new RangeError("high and low lengths must match");
      if (high.some((value, index) => value < low[index])) throw new RangeError("high must be >= low");
    }

    function validateHLC(high: number[], low: number[], close: number[]): void {
      validateHL(high, low);
      validateSeries(close, "close");
      if (close.length !== high.length) throw new RangeError("high, low, and close lengths must match");
      if (close.some((value, index) => value < low[index] || value > high[index])) {
throw new RangeError("close must lie inside each high-low range");
      }
    }
export function ichimoku(high: number[], low: number[], close: number[], conversionPeriod = 9, basePeriod = 26, spanBPeriod = 52, displacement = 26) {
  validateHLC(high, low, close);
  if (![conversionPeriod, basePeriod, spanBPeriod].every((value) => Number.isInteger(value) && value > 0)) throw new RangeError("window periods must be positive integers");
  if (!Number.isInteger(displacement) || displacement < 0) throw new RangeError("displacement must be a non-negative integer");
  const midpoint = (period: number): Numeric[] => high.map((_, index) => {
    if (index < period - 1) return null;
    const start = index - period + 1;
    return (Math.max(...high.slice(start, index + 1)) + Math.min(...low.slice(start, index + 1))) / 2;
  });
  const conversion = midpoint(conversionPeriod);
  const base = midpoint(basePeriod);
  const span_b_origin = midpoint(spanBPeriod);
  const span_a_origin: Numeric[] = Array(high.length).fill(null);
  const span_a_plot: Numeric[] = Array(high.length + displacement).fill(null);
  const span_b_plot: Numeric[] = Array(high.length + displacement).fill(null);
  const lagging_plot: Numeric[] = Array(high.length).fill(null);
  for (let index = 0; index < high.length; index += 1) {
    if (conversion[index] !== null && base[index] !== null) {
      span_a_origin[index] = ((conversion[index] as number) + (base[index] as number)) / 2;
      span_a_plot[index + displacement] = span_a_origin[index];
    }
    if (span_b_origin[index] !== null) span_b_plot[index + displacement] = span_b_origin[index];
    if (index >= displacement) lagging_plot[index - displacement] = close[index];
  }
  return { conversion, base, span_a_origin, span_b_origin, span_a_plot, span_b_plot, lagging_plot };
}
The embedded lab now expands to its full document height, keeping the article as the only scroll surface.