
 By Islam Baraka
The chart is not the conclusion
Most time-series charts tempt us to name shapes before we define them. A smooth line becomes “fundamental value.” A repeated rise and fall becomes “the cycle.” A spectral peak becomes “predictability.” Wavelet Decomposition is valuable precisely when it disciplines that instinct: it gives a reproducible rule for allocating observed variation. It does not certify the economic meaning of the allocation.
The contract in this tutorial is narrow: Orthonormal Haar DWT with periodization and two to four dyadic levels on an even, evenly sampled series. The method is designed to separate a series into localized approximation and detail scales with exact reconstruction. Its defining relation is:
a_{j+1,k}=(a_{j,2k}+a_{j,2k+1})/sqrt(2); d_{j+1,k}=(a_{j,2k}-a_{j,2k+1})/sqrt(2).
That definition is the beginning of analysis, not its end. The sampling interval, preprocessing, parameters, boundary convention, and available sample all influence the result.
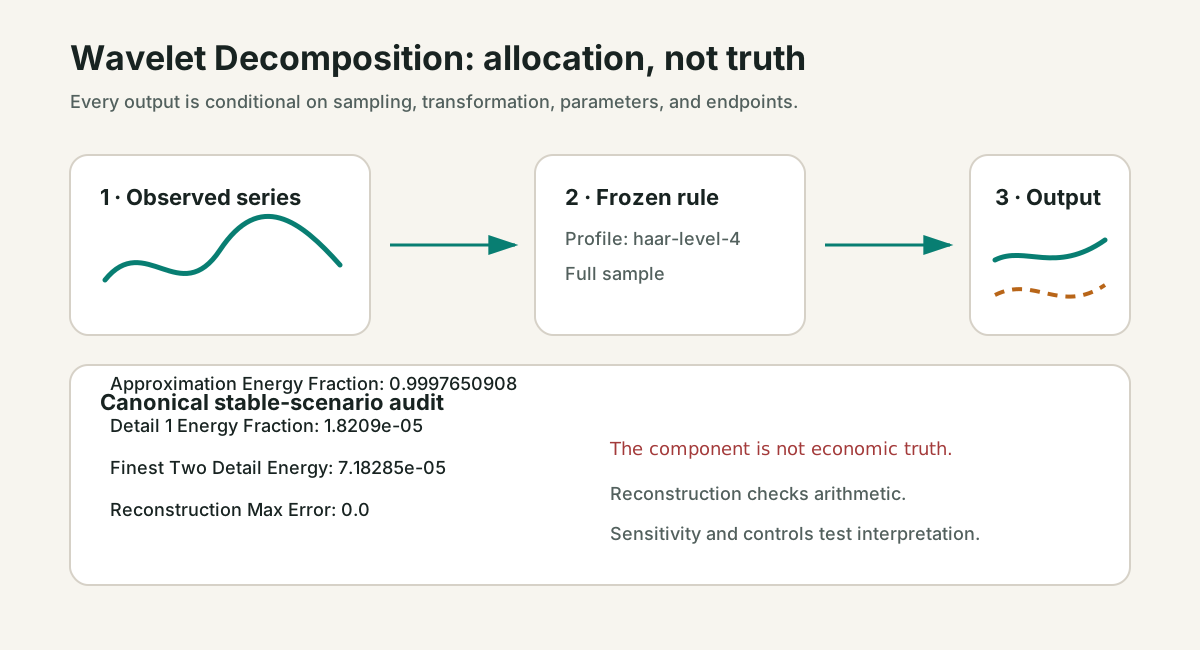
Build the mental model
Each level stores local averages and local differences, so an abrupt event can be localized instead of spread across one global spectrum. Wavelets help inspect multi-scale bursts, jumps, changing cycles, and volatility structure while keeping an exact reconstruction ledger.
Local averages and differences
The Haar transform pairs adjacent values. Their normalized average becomes the next approximation; their normalized difference becomes a detail coefficient. Repeating the operation creates dyadic scales. Inverse transforms reconstruct an approximation component and one detail component per level, and their sum returns the original series to floating-point precision.
Unlike a global periodogram, wavelet details retain location. A jump therefore concentrates in coefficients near the event instead of distributing its explanation across a record-wide sinusoid. Haar’s compact support makes this visible, although its blocky approximation is not universally desirable.
What to inspect
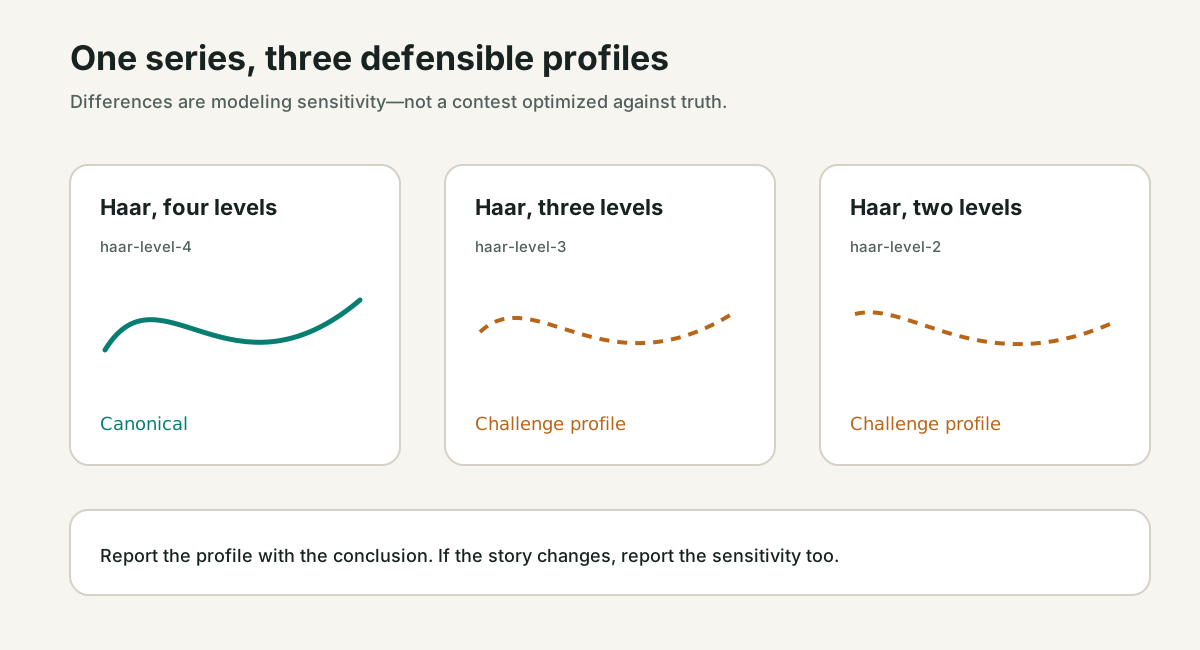
Compare level two and level four on the structural break and single outlier. More levels move energy into coarser scales, but they do not declare which scale is economically “trend.” Raw price levels also make approximation energy dominate; center or transform the series when the analytical question concerns relative variation.
The practical discipline is to name components operationally. Say “the HP cycle under lambda 1,600 on evenly sampled levels,” not “the true cycle.” Say “power near a 12-observation period after linear detrending with a boxcar window,” not “a monthly market rhythm.” The longer wording sounds cautious because it preserves the information needed to reproduce and challenge the result.
Why the lesson uses synthetic data
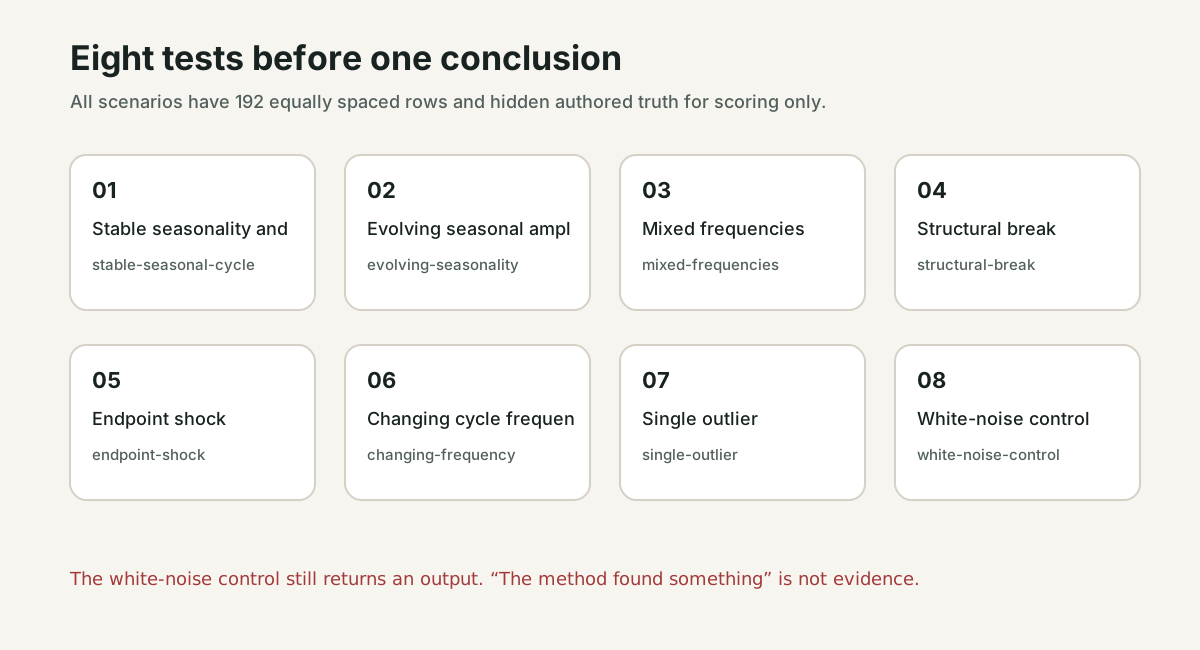
The canonical historical-example decision is not useful. A real asset series would force choices about adjusted prices, exchange calendars, missing sessions, delistings, timezone boundaries, and selection bias. Those are important questions, but they would obscure the decomposition contract. The fixture instead contains eight deterministic scenarios of 192 rows: stable and evolving seasonality, mixed frequencies, a structural break, an endpoint shock, a changing-frequency process, one outlier, and white noise.
Each row includes authored truth fields. They allow us to compute an error in a lesson. They do not enter the algorithm. This separation matters: letting truth leak into parameter selection would turn a demonstration into a rigged contest.
A rigorous reading protocol
Start with provenance. Confirm that observations are equally spaced and that the value field is the intended transformation. “Daily” calendar rows and “daily” trading rows are not interchangeable. Then write down the full parameter profile before looking at the most pleasing chart.
Next inspect the accounting identity. Decomposition methods in this family reconstruct the input by design, except that BK has unavailable centered edges. Exact reconstruction proves arithmetic consistency, not correct interpretation. A periodogram has a different ledger: it distributes scaled power across frequencies rather than reconstructing named trend and cycle arrays.
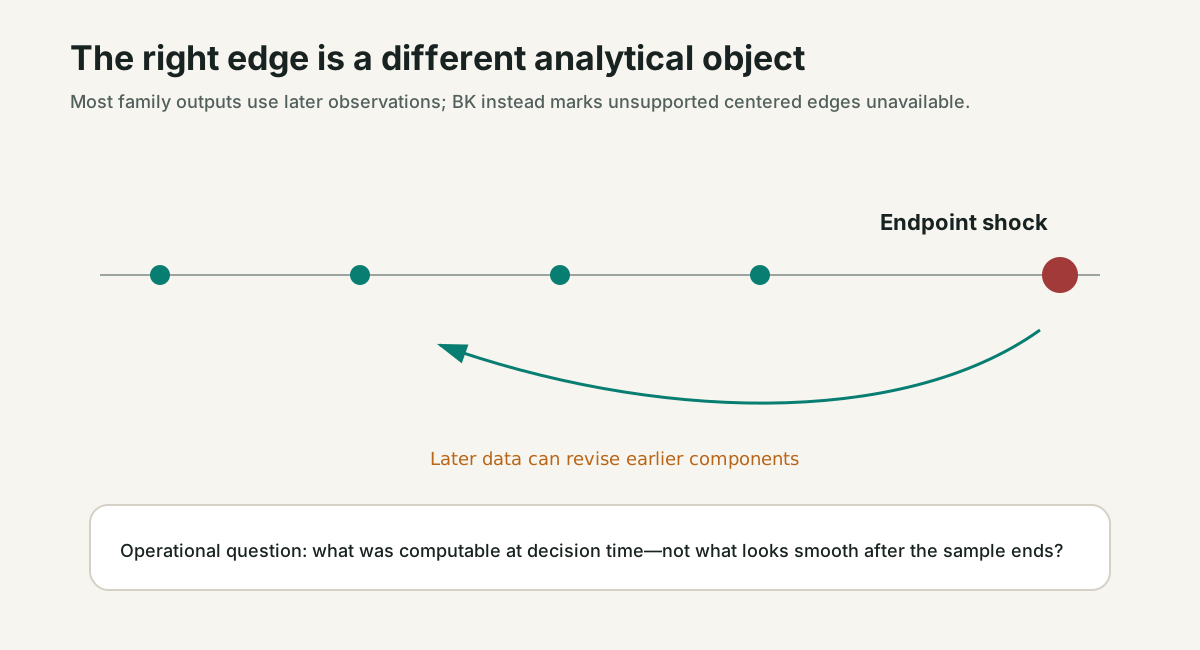
Now challenge the endpoint. Most outputs here use the entire sample. Appending tomorrow’s observation can change yesterday’s component. The playground’s Step button reveals rows for teaching, but the stored curve remains a full-sample answer. That distinction prevents accidental look-ahead reasoning.
Finally compare profiles and controls. If a “cycle” disappears when a reasonable neighboring band is used, the original story is parameter-dependent. If white noise also produces a clean-looking component or a largest peak, visual cleanliness is not sufficient evidence.
Failure modes and boundaries
- Frequency is not economics. A component occupying a mathematical band is not automatically a business cycle, alpha source, or causal force.
- Endpoints are special. This package is retrospective. Later rows can revise earlier components; BK instead declares its unsupported edges as missing.
- Sampling defines period. “Twelve” means twelve observations, not twelve days when rows are irregular or markets skip dates.
- Preprocessing changes the question. Levels, returns, logs, detrending, drift removal, and window choice can produce different stories.
- Selection can overfit. Searching periods, bands, windows, or levels on the same sample makes accidental structure look designed.
- Controls matter. A white-noise series still yields a smooth trend, a largest spectral peak, and wavelet details.
Excluded from this topic: Continuous wavelets, MODWT/SWT, non-Haar families, threshold denoising, wavelet packets, and automated forecasting.
From exploration to a defensible decision
A decomposition can be useful without becoming a signal. It may reveal that seasonal adjustment is necessary before anomaly detection, show that a proposed horizon lies inside a selected band, expose how much an endpoint moves under revision, or help choose a later forecasting model. Those are analytical handoffs.
If you do propose a decision rule, freeze it separately. Specify which data are available at decision time, how parameters were selected, what happens at missing rows, how costs are included, and what out-of-sample period was untouched. Recompute the feature causally if the intended use is causal. A retrospective smoother copied into a backtest is look-ahead leakage even when the formula itself is correct.
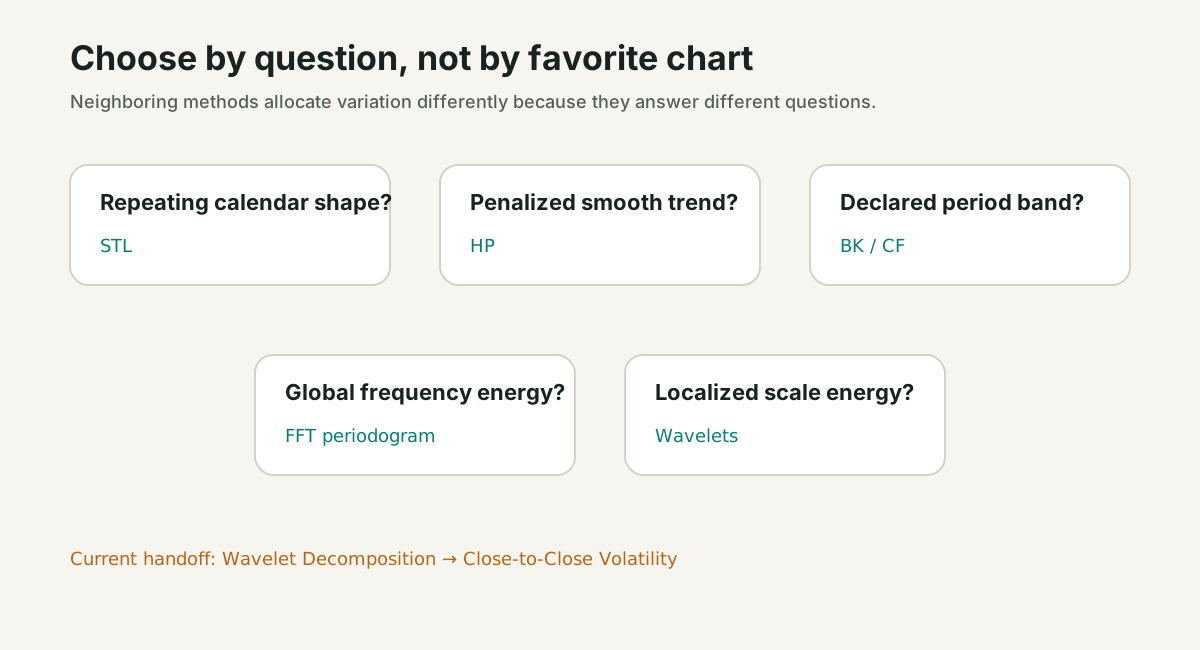
The family sequence is also deliberate. STL separates evolving calendar structure. HP makes smoothness preference explicit. BK and CF compare two bargains for approximating a period band. The FFT periodogram reveals global frequency energy. Wavelets expose localized scale energy. Their outputs answer related but non-equivalent questions.
Reproduce, then disagree productively
The package includes the same eight scenarios, three profiles, Python and TypeScript references, a worked example, static teaching diagrams, and a guided lab. Reproduction gives disagreement a useful target. You can challenge the sampling, transformation, parameter, or interpretation without guessing what a library command did.
The strongest conclusion is often conditional: “Under this frozen definition, the component is stable in the interior but sensitive at the endpoint,” or “A 12-row peak appears after linear detrending but broadens under a Hann window.” Conditional conclusions travel better than certainty because they reveal exactly what another analyst must test.
Sources
- A Theory for Multiresolution Signal Decomposition: The Wavelet Representation — Multiresolution approximation, detail spaces, and fast wavelet decomposition.
- PyWavelets Discrete Wavelet Transform and Signal Extension Modes — Approximation/detail terminology, multilevel DWT, reconstruction, and boundary-mode choices.
Sources establish definitions and known methodological considerations. All scenarios, diagrams, thresholds, and financial workflow guidance are author-derived teaching material reviewed on 2026-07-28.
Rendered from the canonical Mermaid sources linked by this article.
Wavelet Decomposition — Audit Flow
The playback lab reveals rows for pedagogy; the frozen calculation remains retrospective.
ReferencesPrimary sources and evidence notesExpand the source trail, evidence role, and limitations behind the engineering choices.
Expand the source trail, evidence role, and limitations behind the engineering choices.
Reviewed: 2026-07-28
Evidence table
| Key | Source | Type and date | Used for | Boundary |
|---|---|---|---|---|
| MALLAT1989 | A Theory for Multiresolution Signal Decomposition: The Wavelet Representation | Original peer-reviewed paper; 1989-07 | Multiresolution approximation, detail spaces, and fast wavelet decomposition. | This package implements only the orthonormal Haar discrete transform. |
| PYWAVELETS | PyWavelets Discrete Wavelet Transform and Signal Extension Modes | Maintained official documentation; 2026-07-28 | Approximation/detail terminology, multilevel DWT, reconstruction, and boundary-mode choices. | The package implementation is independent and freezes Haar periodization only. |
Source records
MALLAT1989 — A Theory for Multiresolution Signal Decomposition: The Wavelet Representation
- Authors: Stephane G. Mallat
- Type: Original peer-reviewed paper
- Published/version: 1989-07; IEEE TPAMI 11(7), 674-693
- Accessed: 2026-07-28
- URL: https://doi.org/10.1109/34.192463
- Supports: Multiresolution approximation, detail spaces, and fast wavelet decomposition.
- Limitations: This package implements only the orthonormal Haar discrete transform.
PYWAVELETS — PyWavelets Discrete Wavelet Transform and Signal Extension Modes
- Authors: PyWavelets developers
- Type: Maintained official documentation
- Published/version: 2026-07-28; latest documentation
- Accessed: 2026-07-28
- URL: https://pywavelets.readthedocs.io/en/latest/ref/index.html
- Supports: Approximation/detail terminology, multilevel DWT, reconstruction, and boundary-mode choices.
- Limitations: The package implementation is independent and freezes Haar periodization only.
Evidence policy
The formulas, parameter meanings, and historical attribution in this package use the sources above. The deterministic examples, diagrams, diagnostic thresholds, and implementation choices are author-derived teaching material. No synthetic outcome is presented as market evidence, and no decomposition is presented as a profitable signal.
Version notes
The implementation contract is frozen in the data contract rather than delegated to a library default. Documentation links are versioned or reviewed on 2026-07-28. Source claims are intentionally narrower than the tutorial’s teaching examples.
Full dependency-light reference implementations in both supported languages.
/** Dependency-free reference algorithms for D09-F05. */
export type NumericRecord = Record<string, unknown>;

function finiteSeries(values: number[], minimum = 3): number[] {
  if (!Array.isArray(values) || values.length < minimum) throw new Error(`values must contain at least ${minimum} observations`);
  return values.map((value, index) => {
    if (!Number.isFinite(value)) throw new Error(`values[${index}] must be finite`);
    return Number(value);
  });
}

const mean = (values: number[]) => values.reduce((sum, value) => sum + value, 0) / values.length;
function median(values: number[]): number {
  const ordered = [...values].sort((a, b) => a - b);
  const middle = Math.floor(ordered.length / 2);
  return ordered.length % 2 ? ordered[middle] : 0.5 * (ordered[middle - 1] + ordered[middle]);
}
const maxAbs = (values: number[]) => Math.max(...values.map((value) => Math.abs(value)));

function loess(values: number[], span: number, robust?: number[]): number[] {
  const n = values.length;
  if (span < 3 || span > n || span % 2 === 0) throw new Error("LOESS span must be odd and between 3 and n");
  const robustness = robust ?? Array(n).fill(1);
  const result: number[] = [];
  for (let target = 0; target < n; target += 1) {
    const nearest = Array.from({ length: n }, (_, index) => index)
      .sort((a, b) => Math.abs(a - target) - Math.abs(b - target) || a - b)
      .slice(0, span);
    const maxDistance = Math.max(...nearest.map((index) => Math.abs(index - target)));
    let sw = 0, sx = 0, sy = 0, sxx = 0, sxy = 0;
    for (const index of nearest) {
      const distance = maxDistance ? Math.abs(index - target) / maxDistance : 0;
      const tricube = distance < 1 ? (1 - distance ** 3) ** 3 : 0;
      const weight = tricube * robustness[index];
      const centeredX = index - target;
      sw += weight;
      sx += weight * centeredX;
      sy += weight * values[index];
      sxx += weight * centeredX * centeredX;
      sxy += weight * centeredX * values[index];
    }
    const denominator = sw * sxx - sx * sx;
    result.push(sw <= 1e-15 ? values[target] : Math.abs(denominator) <= 1e-15 ? sy / sw : (sy * sxx - sx * sxy) / denominator);
  }
  return result;
}

export function stlDecompose(
  values: number[],
  period = 12,
  seasonalWindow = 7,
  trendWindow = 19,
  robustIterations = 2,
): NumericRecord {
  const series = finiteSeries(values, 2 * period);
  if (!Number.isInteger(period) || period < 2 || series.length < 2 * period) throw new Error("invalid STL period");
  for (const [name, span] of [["seasonalWindow", seasonalWindow], ["trendWindow", trendWindow]] as const) {
    if (!Number.isInteger(span) || span < 3 || span % 2 === 0) throw new Error(`${name} must be an odd integer >= 3`);
  }
  if (trendWindow > series.length) throw new Error("trendWindow cannot exceed series length");
  if (!Number.isInteger(robustIterations) || robustIterations < 0 || robustIterations > 8) throw new Error("invalid robustIterations");
  const n = series.length;
  let trend = loess(series, trendWindow);
  let seasonal = Array(n).fill(0);
  let robustness = Array(n).fill(1);
  for (let outer = 0; outer < robustIterations + 1; outer += 1) {
    for (let inner = 0; inner < 2; inner += 1) {
      const detrended = series.map((value, index) => value - trend[index]);
      const rawSeasonal = Array(n).fill(0);
      for (let phase = 0; phase < period; phase += 1) {
        const indices: number[] = [];
        for (let index = phase; index < n; index += period) indices.push(index);
        const phaseValues = indices.map((index) => detrended[index]);
        const phaseWeights = indices.map((index) => robustness[index]);
        let span = Math.min(seasonalWindow, phaseValues.length);
        if (span % 2 === 0) span -= 1;
        const smoothed = span < 3 ? phaseValues : loess(phaseValues, span, phaseWeights);
        indices.forEach((index, offset) => { rawSeasonal[index] = smoothed[offset]; });
      }
      let lowSpan = Math.min(n % 2 ? n : n - 1, period + (period % 2 === 0 ? 1 : 2));
      lowSpan = Math.max(3, lowSpan);
      const lowPass = loess(rawSeasonal, lowSpan, robustness);
      seasonal = rawSeasonal.map((value, index) => value - lowPass[index]);
      trend = loess(series.map((value, index) => value - seasonal[index]), trendWindow, robustness);
    }
    const residual = series.map((value, index) => value - trend[index] - seasonal[index]);
    if (outer < robustIterations) {
      const scale = 6 * median(residual.map((value) => Math.abs(value)));
      robustness = scale <= 1e-15
        ? Array(n).fill(1)
        : residual.map((value) => Math.abs(value) < scale ? (1 - (Math.abs(value) / scale) ** 2) ** 2 : 0);
    }
  }
  const residual = series.map((value, index) => value - trend[index] - seasonal[index]);
  return {
    observed: series, trend, seasonal, residual, robust_weights: robustness,
    period, seasonal_window: seasonalWindow, trend_window: trendWindow,
    robust_iterations: robustIterations,
    reconstruction_max_error: maxAbs(series.map((value, index) => value - trend[index] - seasonal[index] - residual[index])),
  };
}

function applyHPMatrix(vector: number[], smoothing: number): number[] {
  const result = [...vector];
  for (let index = 0; index < vector.length - 2; index += 1) {
    const second = vector[index] - 2 * vector[index + 1] + vector[index + 2];
    result[index] += smoothing * second;
    result[index + 1] -= 2 * smoothing * second;
    result[index + 2] += smoothing * second;
  }
  return result;
}

export function hpFilter(values: number[], smoothing = 1600): NumericRecord {
  const series = finiteSeries(values, 4);
  if (!Number.isFinite(smoothing) || smoothing < 0) throw new Error("smoothing must be finite and nonnegative");
  if (smoothing === 0) return { trend: [...series], cycle: Array(series.length).fill(0), lambda: 0, iterations: 0, normal_equation_residual: 0, reconstruction_max_error: 0 };
  let x = [...series];
  const ax = applyHPMatrix(x, smoothing);
  let residual = series.map((value, index) => value - ax[index]);
  let direction = [...residual];
  let rr = residual.reduce((sum, value) => sum + value * value, 0);
  const tolerance = 1e-24 * Math.max(1, series.reduce((sum, value) => sum + value * value, 0));
  let iterations = 0;
  for (iterations = 1; iterations <= series.length * 8; iterations += 1) {
    const ad = applyHPMatrix(direction, smoothing);
    const denominator = direction.reduce((sum, value, index) => sum + value * ad[index], 0);
    if (denominator <= 0) throw new Error("HP normal equations lost positive definiteness");
    const alpha = rr / denominator;
    x = x.map((value, index) => value + alpha * direction[index]);
    const nextResidual = residual.map((value, index) => value - alpha * ad[index]);
    const nextRR = nextResidual.reduce((sum, value) => sum + value * value, 0);
    if (nextRR <= tolerance) { residual = nextResidual; rr = nextRR; break; }
    const beta = nextRR / rr;
    direction = nextResidual.map((value, index) => value + beta * direction[index]);
    residual = nextResidual;
    rr = nextRR;
  }
  const trend = x;
  const cycle = series.map((value, index) => value - trend[index]);
  return {
    trend, cycle, lambda: smoothing, iterations, normal_equation_residual: Math.sqrt(rr),
    reconstruction_max_error: maxAbs(series.map((value, index) => value - trend[index] - cycle[index])),
  };
}

export function bkFilter(values: number[], low = 6, high = 32, K = 12): NumericRecord {
  const series = finiteSeries(values, 7);
  if (!Number.isFinite(low) || !Number.isFinite(high) || low < 2 || high <= low) throw new Error("periods require 2 <= low < high");
  if (!Number.isInteger(K) || K < 1 || series.length <= 2 * K) throw new Error("invalid K");
  const omega1 = 2 * Math.PI / high;
  const omega2 = 2 * Math.PI / low;
  let weights = Array.from({ length: 2 * K + 1 }, (_, position) => {
    const lag = Math.abs(position - K);
    return lag === 0 ? (omega2 - omega1) / Math.PI : (Math.sin(omega2 * lag) - Math.sin(omega1 * lag)) / (Math.PI * lag);
  });
  const correction = mean(weights);
  weights = weights.map((weight) => weight - correction);
  const cycle: Array<number | null> = Array(series.length).fill(null);
  const trend: Array<number | null> = Array(series.length).fill(null);
  for (let index = K; index < series.length - K; index += 1) {
    let value = 0;
    for (let offset = -K; offset <= K; offset += 1) value += weights[offset + K] * series[index - offset];
    cycle[index] = value;
    trend[index] = series[index] - value;
  }
  return {
    cycle, trend, weights, low_period: low, high_period: high, K,
    edge_loss_each_side: K, weight_sum: weights.reduce((sum, value) => sum + value, 0),
  };
}

export function cfFilter(values: number[], low = 6, high = 32, drift = true): NumericRecord {
  const series = finiteSeries(values, 5);
  if (!Number.isFinite(low) || !Number.isFinite(high) || low < 2 || high <= low) throw new Error("periods require 2 <= low < high");
  const n = series.length;
  const driftLine = Array.from({ length: n }, (_, index) => drift ? index * (series[n - 1] - series[0]) / (n - 1) : 0);
  const adjusted = series.map((value, index) => value - driftLine[index]);
  const lowerFrequency = 2 * Math.PI / high;
  const upperFrequency = 2 * Math.PI / low;
  const coefficients = [(upperFrequency - lowerFrequency) / Math.PI];
  for (let j = 1; j <= n; j += 1) coefficients.push((Math.sin(upperFrequency * j) - Math.sin(lowerFrequency * j)) / (Math.PI * j));
  const cycle = Array(n).fill(0);
  for (let index = 0; index < n; index += 1) {
    const forwardCount = Math.max(0, n - index - 2);
    const forwardSum = coefficients.slice(1, 1 + forwardCount).reduce((sum, value) => sum + value, 0);
    const pastSum = coefficients.slice(1, index).reduce((sum, value) => sum + value, 0);
    const endpointLast = -0.5 * coefficients[0] - forwardSum;
    const endpointFirst = -coefficients[0] - forwardSum - pastSum - endpointLast;
    let value = coefficients[0] * adjusted[index];
    for (let lag = 1; lag <= forwardCount; lag += 1) value += coefficients[lag] * adjusted[index + lag];
    value += endpointLast * adjusted[n - 1];
    for (let lag = 1; lag < index; lag += 1) value += coefficients[lag] * adjusted[index - lag];
    value += endpointFirst * adjusted[0];
    cycle[index] = value;
  }
  const trend = series.map((value, index) => value - cycle[index]);
  return {
    cycle, trend, drift_line: driftLine, low_period: low, high_period: high,
    drift_removed_before_filtering: drift,
    reconstruction_max_error: maxAbs(series.map((value, index) => value - trend[index] - cycle[index])),
  };
}

function nextPowerOfTwo(value: number): number {
  let result = 1;
  while (result < value) result *= 2;
  return result;
}

function fft(realValues: number[]): [number[], number[]] {
  const n = realValues.length;
  if (n === 0 || (n & (n - 1)) !== 0) throw new Error("FFT length must be a power of two");
  const real = [...realValues], imag = Array(n).fill(0);
  let j = 0;
  for (let i = 1; i < n; i += 1) {
    let bit = n >> 1;
    while (j & bit) { j ^= bit; bit >>= 1; }
    j ^= bit;
    if (i < j) {
      [real[i], real[j]] = [real[j], real[i]];
      [imag[i], imag[j]] = [imag[j], imag[i]];
    }
  }
  for (let length = 2; length <= n; length *= 2) {
    const angle = -2 * Math.PI / length;
    const wlenReal = Math.cos(angle), wlenImag = Math.sin(angle);
    for (let start = 0; start < n; start += length) {
      let wr = 1, wi = 0;
      const half = length / 2;
      for (let offset = 0; offset < half; offset += 1) {
        const even = start + offset, odd = even + half;
        const vr = real[odd] * wr - imag[odd] * wi;
        const vi = real[odd] * wi + imag[odd] * wr;
        const ur = real[even], ui = imag[even];
        real[even] = ur + vr; imag[even] = ui + vi;
        real[odd] = ur - vr; imag[odd] = ui - vi;
        const nextWr = wr * wlenReal - wi * wlenImag;
        wi = wr * wlenImag + wi * wlenReal; wr = nextWr;
      }
    }
  }
  return [real, imag];
}

export function fftPeriodogram(
  values: number[],
  sampleFrequency = 1,
  detrend: "none" | "constant" | "linear" = "linear",
  window: "boxcar" | "hann" = "boxcar",
): NumericRecord {
  const series = finiteSeries(values, 8);
  if (!Number.isFinite(sampleFrequency) || sampleFrequency <= 0) throw new Error("sampleFrequency must be positive");
  if (!["boxcar", "hann"].includes(window)) throw new Error("invalid window");
  if (!["none", "constant", "linear"].includes(detrend)) throw new Error("invalid detrend");
  const center = ["constant", "linear"].includes(detrend) ? mean(series) : 0;
  const xCenter = (series.length - 1) / 2;
  let slope = 0;
  if (detrend === "linear") {
    const denominator = series.reduce((sum, _, index) => sum + (index - xCenter) ** 2, 0);
    slope = series.reduce((sum, value, index) => sum + (index - xCenter) * (value - center), 0) / denominator;
  }
  const weights = window === "boxcar"
    ? Array(series.length).fill(1)
    : series.map((_, index) => 0.5 - 0.5 * Math.cos(2 * Math.PI * index / (series.length - 1)));
  const transformed = series.map((value, index) => (value - center - slope * (index - xCenter)) * weights[index]);
  const nfft = nextPowerOfTwo(series.length);
  const [real, imag] = fft([...transformed, ...Array(nfft - transformed.length).fill(0)]);
  const denominator = sampleFrequency * weights.reduce((sum, value) => sum + value * value, 0);
  const frequency: number[] = [], powerDensity: number[] = [];
  for (let index = 0; index <= nfft / 2; index += 1) {
    const scale = index === 0 || index === nfft / 2 ? 1 : 2;
    frequency.push(index * sampleFrequency / nfft);
    powerDensity.push(scale * (real[index] ** 2 + imag[index] ** 2) / denominator);
  }
  let dominantIndex = 1;
  for (let index = 2; index < powerDensity.length; index += 1) if (powerDensity[index] > powerDensity[dominantIndex]) dominantIndex = index;
  const positivePower = powerDensity.slice(1).reduce((sum, value) => sum + value, 0);
  return {
    frequency, power_density: powerDensity, nfft, sample_frequency: sampleFrequency,
    window, detrend, removed_mean: center, removed_slope_per_observation: slope,
    dominant_index: dominantIndex, dominant_frequency: frequency[dominantIndex],
    dominant_period: 1 / frequency[dominantIndex],
    peak_power_share: positivePower ? powerDensity[dominantIndex] / positivePower : 0,
  };
}

function haarInverse(approximation: number[], details: number[][]): number[] {
  let current = [...approximation];
  for (const detail of [...details].reverse()) {
    if (detail.length !== current.length) throw new Error("coefficient lengths do not align");
    const expanded: number[] = [];
    current.forEach((average, index) => {
      expanded.push((average + detail[index]) / Math.sqrt(2));
      expanded.push((average - detail[index]) / Math.sqrt(2));
    });
    current = expanded;
  }
  return current;
}

export function haarWavelet(values: number[], levels = 4): NumericRecord {
  const series = finiteSeries(values, 4);
  if (!Number.isInteger(levels) || levels < 1) throw new Error("levels must be positive");
  if (series.length % (2 ** levels) !== 0) throw new Error("series length must be divisible by 2**levels");
  let approximation = [...series];
  const details: number[][] = [];
  for (let level = 0; level < levels; level += 1) {
    const next: number[] = [], detail: number[] = [];
    for (let index = 0; index < approximation.length; index += 2) {
      next.push((approximation[index] + approximation[index + 1]) / Math.sqrt(2));
      detail.push((approximation[index] - approximation[index + 1]) / Math.sqrt(2));
    }
    approximation = next; details.push(detail);
  }
  const reconstructed = haarInverse(approximation, details);
  const approximationComponent = haarInverse(approximation, details.map((detail) => Array(detail.length).fill(0)));
  const detailComponents = details.map((_, selected) => haarInverse(
    Array(approximation.length).fill(0),
    details.map((detail, level) => level === selected ? [...detail] : Array(detail.length).fill(0)),
  ));
  const approximationEnergy = approximation.reduce((sum, value) => sum + value * value, 0);
  const detailEnergy = details.map((detail) => detail.reduce((sum, value) => sum + value * value, 0));
  const totalEnergy = approximationEnergy + detailEnergy.reduce((sum, value) => sum + value, 0);
  return {
    approximation_coefficients: approximation, detail_coefficients: details,
    approximation_component: approximationComponent, detail_components: detailComponents,
    reconstructed, levels, wavelet: "haar", boundary_mode: "periodization",
    approximation_energy_fraction: totalEnergy ? approximationEnergy / totalEnergy : 0,
    detail_energy_fractions: detailEnergy.map((energy) => totalEnergy ? energy / totalEnergy : 0),
    reconstruction_max_error: maxAbs(series.map((value, index) => value - reconstructed[index])),
  };
}

export function runTopic(kind: string, values: number[], config: Record<string, unknown>): NumericRecord {
  if (kind === "stl") return stlDecompose(values, Number(config.period), Number(config.seasonal_window), Number(config.trend_window), Number(config.robust_iterations));
  if (kind === "hp") return hpFilter(values, Number(config.lambda));
  if (kind === "bk") return bkFilter(values, Number(config.low), Number(config.high), Number(config.K));
  if (kind === "cf") return cfFilter(values, Number(config.low), Number(config.high), Boolean(config.drift));
  if (kind === "fft") return fftPeriodogram(values, Number(config.sample_frequency), config.detrend as "none" | "constant" | "linear", config.window as "boxcar" | "hann");
  if (kind === "wavelet") return haarWavelet(values, Number(config.levels));
  throw new Error(`unsupported topic kind: ${kind}`);
}
The embedded lab now expands to its full document height, keeping the article as the only scroll surface.