
 By Islam Baraka
Can two consecutive daily high–low ranges separate spread from fundamental volatility? The answer matters because a visible quote, a signed execution, a later midpoint, and a low-frequency proxy describe different objects. This tutorial gives practitioners a usable measurement and gives builders the data, clock, and validation contract needed to reproduce it.
Start with the decision
Volatility grows with the measurement interval while the spread component does not, allowing one- and two-day ranges to be compared. The canonical package selects Simple two-day high–low estimator with negative alpha clipped to zero; no overnight-return adjustment. The primary Corwin and Schultz (2012), A Simple Way to Estimate Bid-Ask Spreads supports that definition. The numbers below are synthetic and the arithmetic is author-derived.
Choose the right variant
| Variant | Definition | Best use | Main limitation |
|---|---|---|---|
| Simple two-day estimator | Original one- and two-day range relation | Low-frequency spread proxy | Overnight moves and volatility assumptions matter |
| Nonnegative clipped | max(alpha, 0) before transform | Stable published series | Zero can mean clipping, not frictionless trading |
| Overnight-adjusted variants | Modify ranges for overnight returns | Markets with material close-to-open moves | Requires a separately specified method |
Evidence and applicability boundary
This is a research estimator or proxy, not a Rule 605 statistic. Its sample, calendar, currency, and adjustment conventions must be frozen before comparison.
Define the measurement
Every price must share one instrument, currency, adjustment basis, and declared quote scope. Intraday measures also need synchronized clocks and correction policy. Daily proxies need one trading calendar and corporate-action basis.
<!-- ENHANCEMENT:F02-TOPIC-SPECIFIC -->Choose the correct measurement variant
| Convention | Use when | What changes |
|---|---|---|
| Simple clipped estimator | Teaching the paper’s transparent two-day construction | Clips negative two-day alpha to zero |
| Overnight-adjusted estimator | Close-to-open data and a declared adjustment exist | Attempts to remove overnight range contamination |
| Monthly aggregation | A research panel is the target | Requires a frozen pairing and averaging policy |
Nearest comparison: Roll uses serial covariance; direct spreads require intraday quotes or quote-matched trades.
Do not substitute: It is a model-based proxy and is sensitive to overnight moves and sparse price observation.
Work the canonical example
Input: {"high_day_1": 101.0, "low_day_1": 99.0, "high_day_2": 101.5, "low_day_2": 99.5, "clip_negative": true}.
- β = 0.000796082611872 from the two squared one-day log ranges.
- γ = 0.000621951144667 from the squared two-day high–low range.
- α = 0.00790893375246; the relative spread is 0.00790889252659, or 79.0889252659 bps.
See the state before the code
The annotated visual identifies the measurement anchors, active relationship, and failure boundary. Read the labels before comparing the highlighted output.
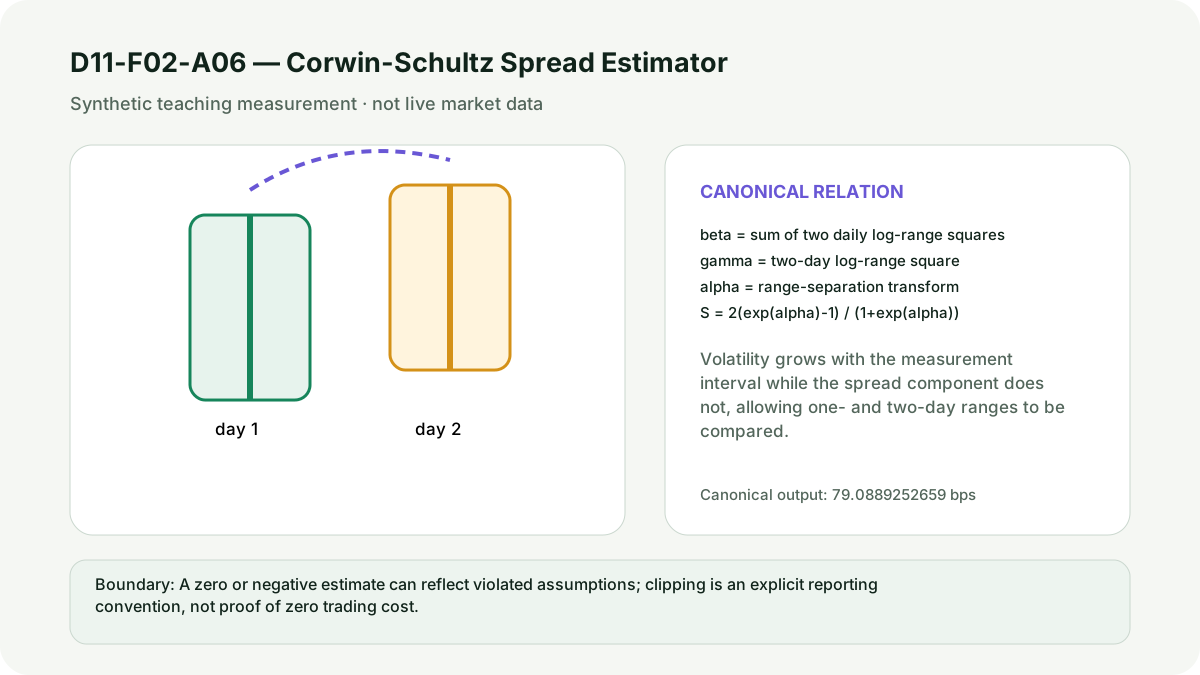
Open the annotated visual at full size · Open the guided playground
Implement the contract
- validate two consecutive high–low pairs
- calculate β from one-day log ranges
- calculate γ from combined two-day range
- solve α
- clip α at zero if selected
- transform α into relative spread
The Python and TypeScript references share the same synthetic JSON fixtures and error behavior. They keep raw precision until presentation. Production systems should add fixed-point/decimal prices, feed sequence handling, timestamp normalization, corrections, market-status filters, and licensed source lineage.
<!-- ENHANCEMENT:F02-INTERPRETATION -->Interpret before aggregating
Read the state before ranking or averaging the value:
| Check | Question |
|---|---|
| Range validity | Are highs positive and no lower than lows? |
| Overnight effect | Could a gap inflate the two-day range without entering either daily range? |
| Clipping | Is a negative estimate preserved diagnostically before presentation clipping? |
A useful report names the measurement question, variant, scope, clock, unit, weighting rule, valid observation count, and unsupported states. A single headline value is not enough audit evidence.
Validate what the result means
The checks cover canonical arithmetic, a property, a boundary, an invalid state, and cross-language parity. A zero or negative estimate can reflect violated assumptions; clipping is an explicit reporting convention, not proof of zero trading cost. A successful calculation does not prove a profitable strategy, fair execution, or compliance.
| State | Decision boundary | Required response |
|---|---|---|
| Negative alpha with clipping | alpha_raw < 0 and clip=true | Return zero with clipped-to-zero |
| Negative alpha without clipping | alpha_raw < 0 and clip=false | Preserve diagnostic negative estimate; do not call it a valid spread |
| Nonconsecutive sessions | calendar gap violates the selected window | Reject or route to another documented convention |
Compare the neighboring methods
Corwin–Schultz uses daily highs and lows and generally requires fewer observations than the Roll covariance estimator. Quoted, effective, and realized spreads are direct intraday measurements when synchronized quote/trade data exist. Roll and Corwin–Schultz are low-frequency spread estimators with model assumptions. Amihud is a return-to-volume illiquidity proxy rather than a spread.
<!-- ENHANCEMENT:F02-VISUAL-SEQUENCE -->Use four additional audit views
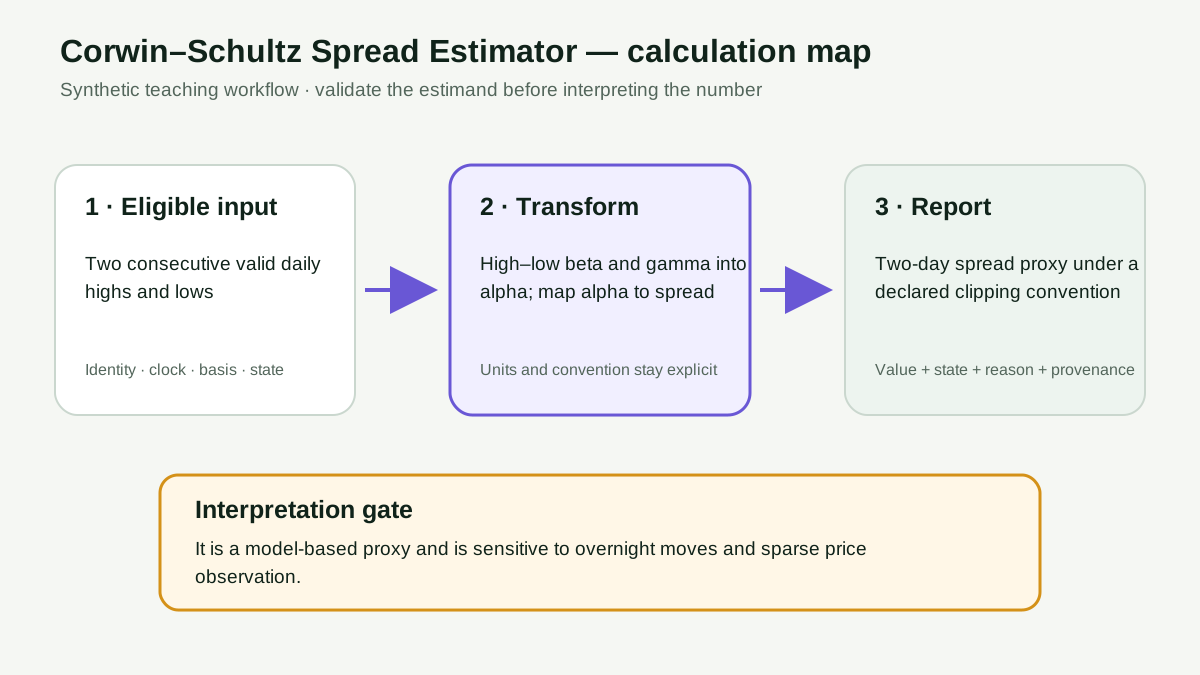
The map separates eligible evidence, transformation, and reason-bearing output.
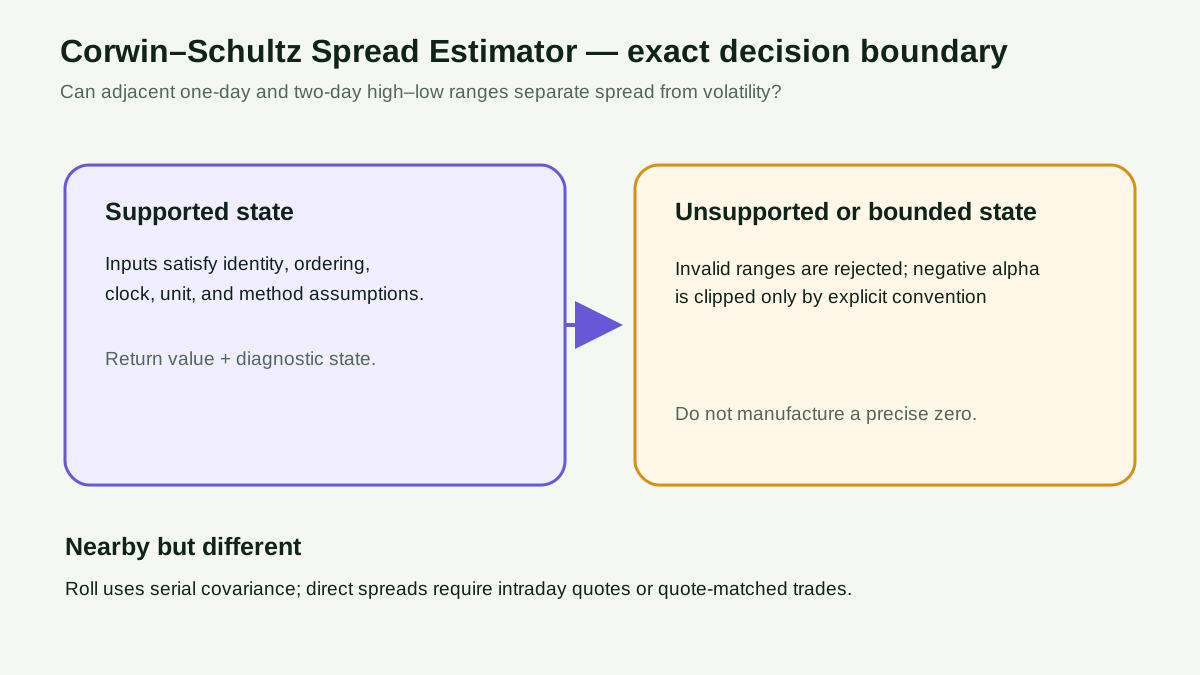
The boundary view shows when the method returns a supported value and when it must return an explicit unsupported or bounded state.
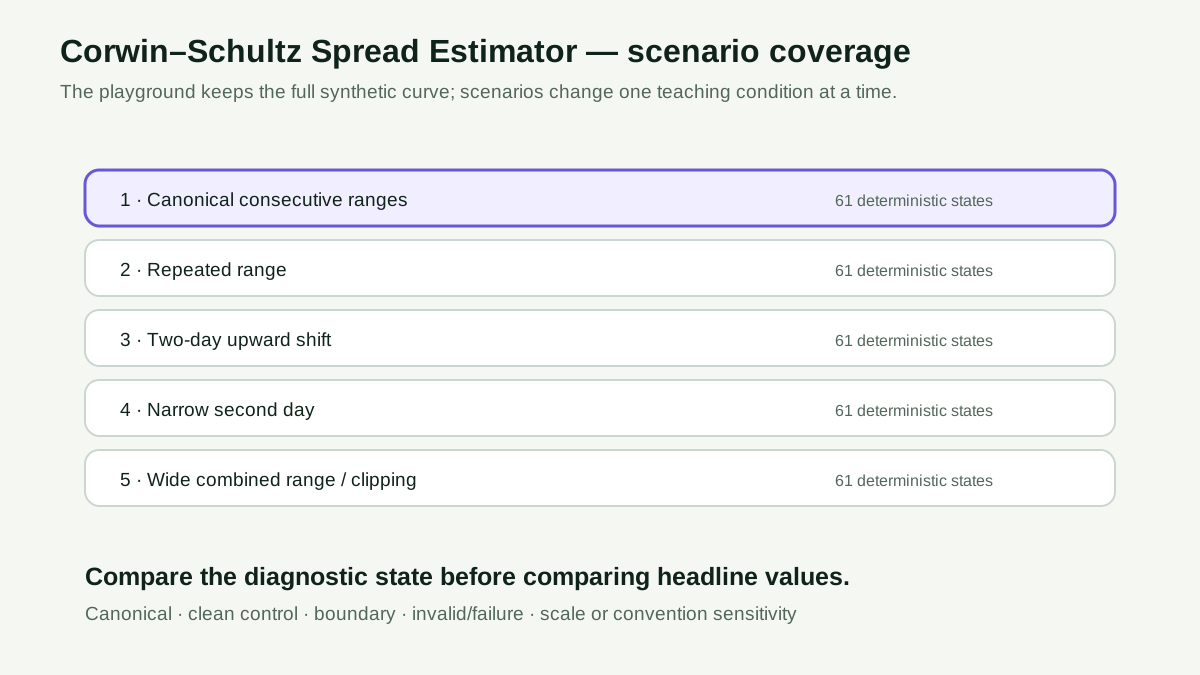
The matrix confirms that the playground retains five distinct scenarios and 61 deterministic states per scenario rather than relying on a tiny toy example.
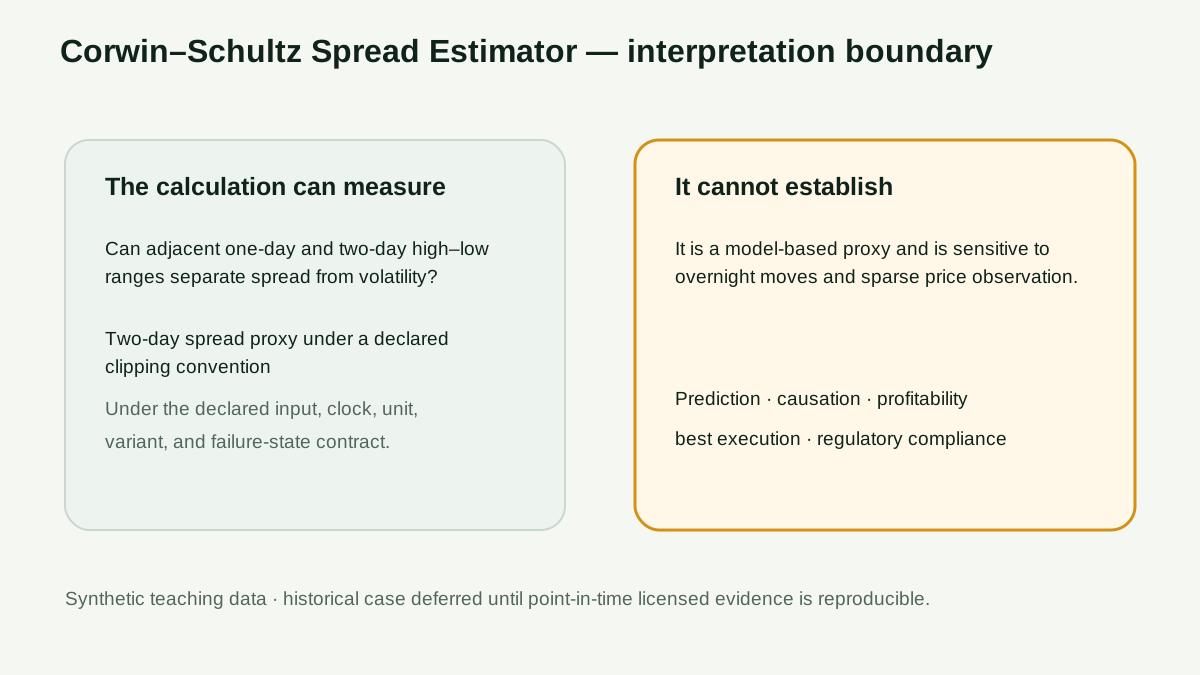
The final view separates what the calculation measures from causal, performance, identity, best-execution, and compliance claims it cannot prove.
Evidence boundary
A historical case is deferred until point-in-time identity, licensed source, conditions/corrections, session policy, corporate-action basis, and redistribution permission are archived. NYSE describes Daily TAQ as containing trades, quotes, NBBO, and administrative messages, but its data remain licensed.
Summary and next topic
You can now calculate the simple two-day Corwin–Schultz relative spread estimate, audit its assumptions, and distinguish it from nearby liquidity measures. Continue with Order Flow Imbalance.
Primary references
Rendered from the canonical Mermaid sources linked by this article.
Corwin-Schultz Spread Estimator validation flow
ReferencesPrimary sources and evidence notesExpand the source trail, evidence role, and limitations behind the engineering choices.
Expand the source trail, evidence role, and limitations behind the engineering choices.
Source roles are narrow. Primary sources support definitions and data requirements; all numerical fixtures in this package are visibly synthetic and author-derived.
SRC-01 — Corwin and Schultz (2012), A Simple Way to Estimate Bid-Ask Spreads
- Organization or authors: The Journal of Finance
- Source type: Official rule or original peer-reviewed paper
- Publication or effective date: 2012-03-27
- Version: Source page or paper version at access
- URL or DOI: Corwin and Schultz (2012), A Simple Way to Estimate Bid-Ask Spreads
- Accessed: 2026-07-29
- Jurisdiction: Research model; market-neutral until implemented
- Supports: original high–low spread estimator and nonnegative simple version
- Limitations: Does not validate the repository's synthetic numbers or make the selected convention universal.
SRC-02 — NYSE Daily TAQ product description
- Organization or authors: New York Stock Exchange
- Source type: Official market-data product documentation
- Publication or effective date: Current product page; accessed 2026-07-29
- Version: Source page or paper version at access
- URL or DOI: NYSE Daily TAQ product description
- Accessed: 2026-07-29
- Jurisdiction: U.S. equities
- Supports: availability of consolidated trades, quotes, NBBO, and administrative messages needed for reproducible intraday measurement
- Limitations: Product access and redistribution are licensed; the page does not supply a free historical fixture.
Full dependency-light reference implementations in both supported languages.
export type TradeSide = "buy" | "sell";

function numberValue(name: string, value: unknown, positive = false): number {
  if (typeof value !== "number" || !Number.isFinite(value)) {
    throw new Error(`${name} must be a finite number`);
  }
  if (positive && value <= 0) throw new Error(`${name} must be greater than zero`);
  return value;
}

function sideDirection(side: unknown): number {
  if (side === "buy") return 1;
  if (side === "sell") return -1;
  throw new Error("side must be 'buy' or 'sell'");
}

function quoteValues(bid: unknown, ask: unknown): [number, number, number] {
  const bidValue = numberValue("bid", bid, true);
  const askValue = numberValue("ask", ask, true);
  if (askValue < bidValue) throw new Error("ask must be greater than or equal to bid");
  return [bidValue, askValue, (bidValue + askValue) / 2];
}

export function quotedSpread(bid: unknown, ask: unknown) {
  const [bidValue, askValue, midpoint] = quoteValues(bid, ask);
  const spread = askValue - bidValue;
  const relative = spread / midpoint;
  return {
    model: "quoted-spread",
    bid: bidValue,
    ask: askValue,
    midpoint,
    quoted_spread: spread,
    quoted_spread_relative: relative,
    quoted_spread_bps: relative * 10_000,
    state: spread === 0 ? "locked" : "two-sided",
  };
}

export function effectiveSpread(
  bid: unknown,
  ask: unknown,
  tradePrice: unknown,
  side: TradeSide,
) {
  const quote = quotedSpread(bid, ask);
  const trade = numberValue("trade_price", tradePrice, true);
  const direction = sideDirection(side);
  const effective = 2 * direction * (trade - quote.midpoint);
  const relative = effective / quote.midpoint;
  const quoteSidePrice = direction === 1 ? quote.ask : quote.bid;
  const priceImprovementPerShare = direction * (quoteSidePrice - trade);
  const roundTripSpreadReduction = quote.quoted_spread - effective;
  const tolerance = 1e-12;
  let state = "outside-quote";
  if (effective < -tolerance) state = "through-midpoint-improvement";
  else if (roundTripSpreadReduction > tolerance) state = "inside-quote";
  else if (Math.abs(roundTripSpreadReduction) <= tolerance) state = "at-quote";
  return {
    ...quote,
    model: "effective-spread",
    trade_price: trade,
    side,
    direction,
    effective_spread: effective,
    effective_spread_relative: relative,
    effective_spread_bps: relative * 10_000,
    quote_side_price: quoteSidePrice,
    price_improvement_per_share: priceImprovementPerShare,
    round_trip_spread_reduction: roundTripSpreadReduction,
    state,
  };
}

export function realizedSpread(
  bidAtTrade: unknown,
  askAtTrade: unknown,
  tradePrice: unknown,
  side: TradeSide,
  bidAfter: unknown,
  askAfter: unknown,
  horizonSeconds: unknown = 300,
) {
  const initial = effectiveSpread(bidAtTrade, askAtTrade, tradePrice, side);
  const [futureBid, futureAsk, futureMidpoint] = quoteValues(bidAfter, askAfter);
  const horizon = numberValue("horizon_seconds", horizonSeconds, true);
  const realized = 2 * initial.direction * (initial.trade_price - futureMidpoint);
  const priceImpact = 2 * initial.direction * (futureMidpoint - initial.midpoint);
  const relative = realized / initial.midpoint;
  const impactRelative = priceImpact / initial.midpoint;
  return {
    model: "realized-spread",
    side,
    direction: initial.direction,
    trade_price: initial.trade_price,
    midpoint_at_trade: initial.midpoint,
    midpoint_after: futureMidpoint,
    bid_after: futureBid,
    ask_after: futureAsk,
    horizon_seconds: horizon,
    effective_spread: initial.effective_spread,
    realized_spread: realized,
    realized_spread_relative: relative,
    realized_spread_bps: relative * 10_000,
    price_impact: priceImpact,
    price_impact_relative: impactRelative,
    price_impact_bps: impactRelative * 10_000,
    decomposition_error: initial.effective_spread - realized - priceImpact,
    state: realized < 0 ? "negative-realized" : "nonnegative-realized",
  };
}

function finiteSeries(name: string, values: unknown, minimum: number): number[] {
  if (!Array.isArray(values)) throw new Error(`${name} must be an array`);
  const result = values.map((value, index) => numberValue(`${name}[${index}]`, value, true));
  if (result.length < minimum) throw new Error(`${name} must contain at least ${minimum} observations`);
  return result;
}

function mean(values: number[]): number {
  return values.reduce((total, value) => total + value, 0) / values.length;
}

export function rollSpread(prices: unknown) {
  const priceValues = finiteSeries("prices", prices, 4);
  const changes = priceValues.slice(1).map((value, index) => value - priceValues[index]);
  const lagged = changes.slice(0, -1);
  const current = changes.slice(1);
  if (current.length < 2) throw new Error("prices must create at least two covariance pairs");
  const laggedMean = mean(lagged);
  const currentMean = mean(current);
  const covariance = lagged.reduce(
    (total, value, index) => total + (value - laggedMean) * (current[index] - currentMean),
    0,
  ) / (current.length - 1);
  const meanPrice = mean(priceValues);
  const covarianceTolerance = 1e-15;
  const spread = covariance < -covarianceTolerance ? 2 * Math.sqrt(-covariance) : null;
  const relative = spread === null ? null : spread / meanPrice;
  return {
    model: "roll-spread",
    observation_count: priceValues.length,
    change_count: changes.length,
    covariance_pair_count: current.length,
    lag1_price_change_covariance: covariance,
    covariance_tolerance: covarianceTolerance,
    mean_price: meanPrice,
    spread_estimate: spread,
    spread_estimate_relative: relative,
    spread_estimate_bps: relative === null ? null : relative * 10_000,
    state: spread === null ? "not-identified" : "estimated",
  };
}

export function amihudIlliquidity(
  closes: unknown,
  dollarVolumes: unknown,
  scale: unknown = 1_000_000,
) {
  const closeValues = finiteSeries("closes", closes, 2);
  const volumeValues = finiteSeries("dollar_volumes", dollarVolumes, 2);
  if (closeValues.length !== volumeValues.length) {
    throw new Error("closes and dollar_volumes must have equal length");
  }
  const scaleValue = numberValue("scale", scale, true);
  const returns = closeValues.slice(1).map((value, index) => value / closeValues[index] - 1);
  const ratios = returns.map((value, index) => Math.abs(value) / volumeValues[index + 1]);
  const raw = mean(ratios);
  return {
    model: "amihud-illiquidity",
    observation_count: closeValues.length,
    return_count: returns.length,
    returns,
    daily_illiquidity: ratios,
    illiquidity_per_currency_unit: raw,
    scale: scaleValue,
    illiquidity_per_scaled_volume: raw * scaleValue,
    state: "estimated",
  };
}

export function corwinSchultzSpread(
  highDay1: unknown,
  lowDay1: unknown,
  highDay2: unknown,
  lowDay2: unknown,
  clipNegative = true,
) {
  const h1 = numberValue("high_day_1", highDay1, true);
  const l1 = numberValue("low_day_1", lowDay1, true);
  const h2 = numberValue("high_day_2", highDay2, true);
  const l2 = numberValue("low_day_2", lowDay2, true);
  if (h1 < l1 || h2 < l2) throw new Error("each daily high must be greater than or equal to its low");
  const beta = Math.log(h1 / l1) ** 2 + Math.log(h2 / l2) ** 2;
  const gamma = Math.log(Math.max(h1, h2) / Math.min(l1, l2)) ** 2;
  const denominator = 3 - 2 * Math.sqrt(2);
  const alphaRaw = (
    (Math.sqrt(2 * beta) - Math.sqrt(beta)) / denominator
    - Math.sqrt(gamma / denominator)
  );
  const alpha = clipNegative ? Math.max(0, alphaRaw) : alphaRaw;
  const expAlpha = Math.exp(alpha);
  const spread = 2 * (expAlpha - 1) / (1 + expAlpha);
  return {
    model: "corwin-schultz-spread",
    beta,
    gamma,
    alpha_raw: alphaRaw,
    alpha_used: alpha,
    spread_estimate_relative: spread,
    spread_estimate_bps: spread * 10_000,
    clip_negative: clipNegative,
    state: clipNegative && alphaRaw < 0 ? "clipped-to-zero" : "estimated",
  };
}

export function calculate(topicId: string, inputs: Record<string, any>) {
  if (topicId === "D11-F02-A01") return quotedSpread(inputs.bid, inputs.ask);
  if (topicId === "D11-F02-A02") return effectiveSpread(inputs.bid, inputs.ask, inputs.trade_price, inputs.side);
  if (topicId === "D11-F02-A03") return realizedSpread(
    inputs.bid_at_trade,
    inputs.ask_at_trade,
    inputs.trade_price,
    inputs.side,
    inputs.bid_after,
    inputs.ask_after,
    inputs.horizon_seconds ?? 300,
  );
  if (topicId === "D11-F02-A04") return rollSpread(inputs.prices);
  if (topicId === "D11-F02-A05") return amihudIlliquidity(
    inputs.closes,
    inputs.dollar_volumes,
    inputs.scale ?? 1_000_000,
  );
  if (topicId === "D11-F02-A06") return corwinSchultzSpread(
    inputs.high_day_1,
    inputs.low_day_1,
    inputs.high_day_2,
    inputs.low_day_2,
    inputs.clip_negative ?? true,
  );
  throw new Error(`unsupported topic_id: ${topicId}`);
}
The embedded lab now expands to its full document height, keeping the article as the only scroll surface.