
 By Islam Baraka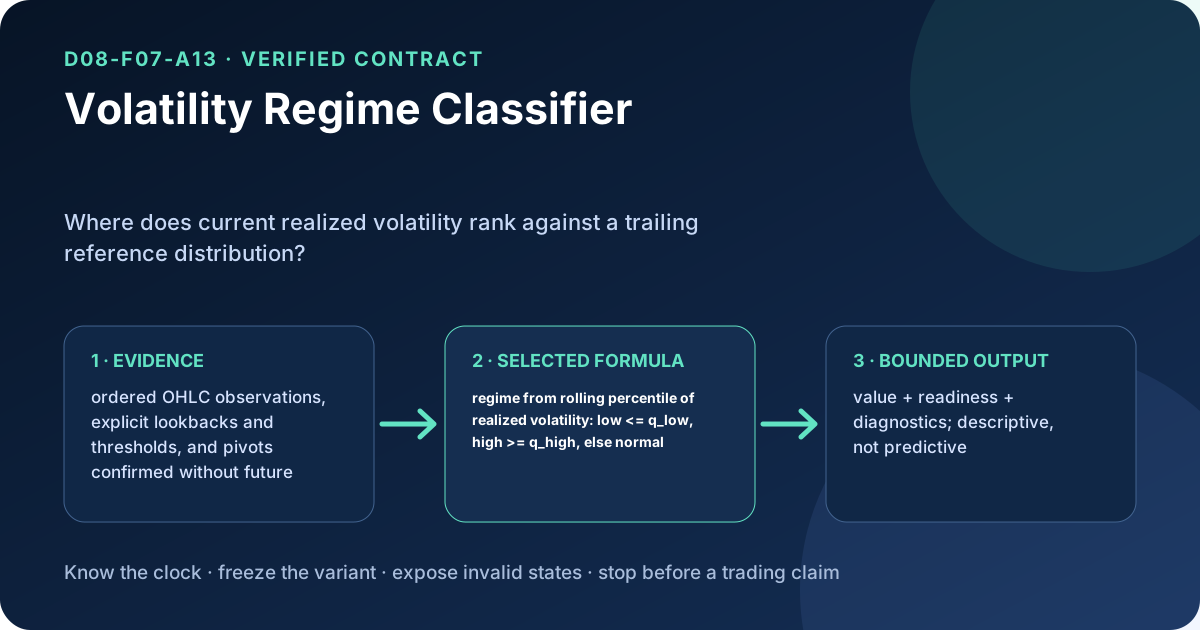
Hero takeaway: Computes realized volatility as the standard deviation of simple close returns over period bars, then ranks each reading against the last rank_period of them: bottom quartile is low, top quartile is high, everything between is normal. Open the hero at full size.
<!-- LEVEL-2-HERO:END -->If you have ever placed Volatility Regime Classifier on a chart and wondered why another platform showed a different answer, the problem probably was not arithmetic. The quiet differences usually live in the input source, lookback, seed, warm-up, equality rule, session reset, or a vendor-specific convention hidden behind the same label.
This guide gives you an audit trail instead of a magic line. You will see exactly what the topic measures, which formula this package selects, how to walk a synthetic example, what to test, and where interpretation must stop. The practical question is: Where does current realized volatility rank against a trailing reference distribution?
The source lineage and maintained software context are recorded in Technical Analysis: Modern Perspectives (CFA Institute Research Foundation), TA-Lib maintained source, Long-Term Storage Capacity of Reservoirs. Those sources establish vocabulary and implementation history; they do not prove that the indicator predicts returns or that every product should share one default.
What you will be able to do
By the end, you can:
- explain Volatility Regime Classifier in plain language before reaching for notation;
- validate ordered OHLC observations, explicit lookbacks and thresholds, and pivots confirmed without future leakage;
- reproduce the selected calculation or review someone else's implementation;
- distinguish
waiting,invalid,calculated, andinterpretedstates; - diagnose the most common cross-platform mismatches; and
- compare Volatility Regime Classifier with range, trend, volatility, entropy, and breakout classifiers under the same causal clock without calling one universally better.
You need only basic arithmetic and ordered time-series intuition. When OHLC is used,
O, H, L, and C mean open, high, low, and close for one completed observation.
No trading-strategy knowledge is required.
Start with the useful intuition
Volatility Regime Classifier is a lens applied to already observed data. Its job is to make one feature of the path easier to inspect. The output may describe geometry, relative location, smoothed direction, realized range, volume-weighted state, statistical position, or phase. It does not add information that was absent from the inputs.
That distinction matters. A mathematically correct output answers what the selected transformation says now. It does not answer whether the next price will rise, whether an order should be placed, or whether a result will survive costs. Those are separate questions requiring point-in-time data and an outcome study.
Before looking at the formula, inspect the contract map. Notice that validation and timing come first; interpretation comes last.
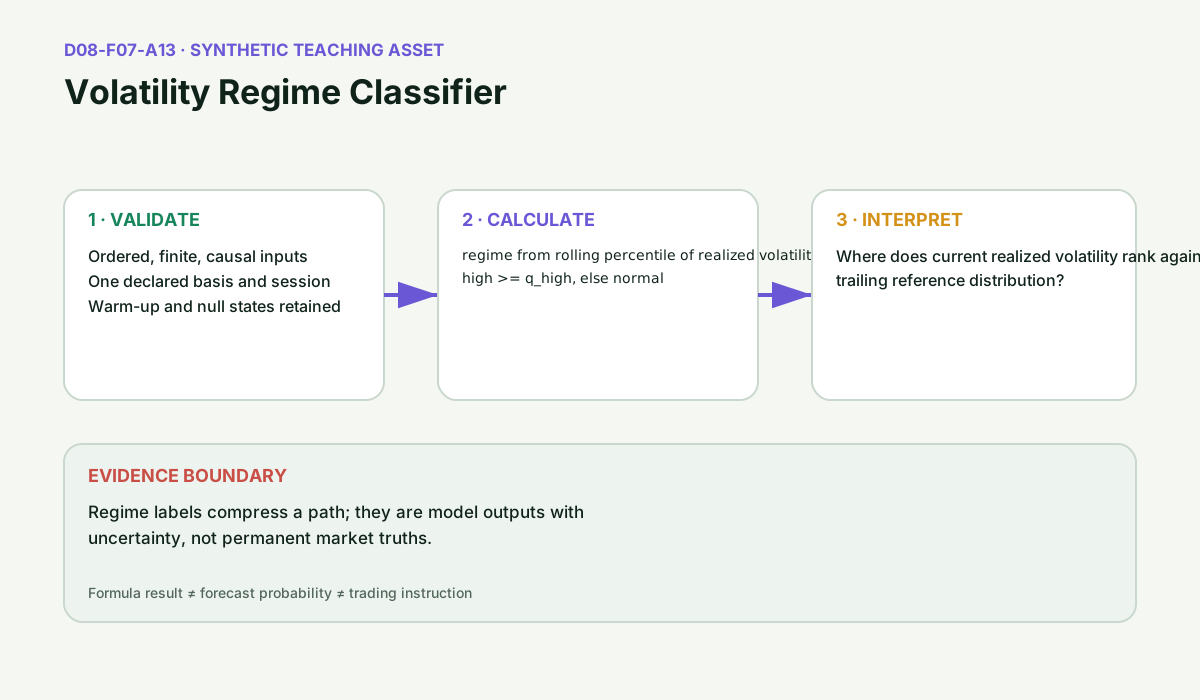
Open the concept map at full size.
Freeze the selected convention
This topic uses a transparent package-selected convention because the label has multiple published or platform-specific implementations. The printed formula, seed, timing, and invalid states—not the short name—define reproducible behavior.
rv_t = popstd(r_(t-n+1..t)) with r_k = C_k/C_(k-1) - 1; rank_t = count(rv_j <= rv_t for j in t-m+1..t) / m; low if rank_t <= 0.25, high if rank_t >= 0.75, else normal
Four choices inside that line are exactly where two implementations of the same label diverge, so this package names all four:
- Return construction.
r_k = C_k/C_(k-1) - 1is a simple close-to-close return, not a log return. It is undefined at index 0 and whenever the prior close is zero. - Dispersion convention.
popstddivides the sum of squared deviations by the window lengthn, not byn - 1. This is the population convention; a package using the sample convention reports a uniformly larger number from the same data. - Window inclusion. Both windows end on the current bar and include it. The
volatility window covers returns
t-n+1throught; the rank window covers volatilitiest-m+1throught, wheremisrank_period. - Rank convention. The rank is the share of the window that is less than or
equal to the current reading, so it always includes the current reading itself
and lies in
(0, 1]. Ties count on the low side of the comparison, which pulls a repeated value towardnormal.
The two thresholds are inclusive at both ends: rank_t = 0.25 is already low and
rank_t = 0.75 is already high.
The two series also become available at different times. volatility first appears
at index n, because the return at index 0 is null and the window refuses to span
it. regime needs m consecutive non-null volatilities behind it, so its first
label lands at index n + m - 1 — index 59 under the defaults n = 20 and
m = 40, even though ready_at reports 20. rank_period must be an integer no
smaller than period.
Read every subscript as an observation index, not automatically a day. A window of
n=14 can mean 14 daily bars, 14 five-minute bars, or 14 eligible events; those are
different measurements. Calculate with full precision and round only for display.
Where a denominator can be zero, the correct output is an explicit undefined state unless the contract names another policy. Where recursion is present, publish the seed and warm-up. Where a pivot or session range must be confirmed, publish the first timestamp at which it was knowable. A later chart can look obvious while still being impossible to reproduce causally.
The data contract is part of the algorithm
Use ordered OHLC observations, explicit lookbacks and thresholds, and pivots confirmed without future leakage. The minimum production record should also preserve:
| Field | Why it matters | Safe policy |
|---|---|---|
| timestamp | Orders the evidence clock | timezone-aware, oldest to newest, unique after declared correction precedence |
| price fields | Supply the mathematical input | finite, same currency and adjustment basis |
| volume, when used | Supplies a weight or activity field | name unit, venue coverage, session, and zero/missing policy |
| parameters | Fix the selected variant | store with every output or model version |
| availability time | Prevents future leakage | compute only after required source fields are knowable |
| revision state | Makes replay deterministic | identify provisional, corrected, or final observations |
Reject NaN, infinity, mixed split-adjustment bases, unexplained duplicate timestamps, and out-of-order observations. Do not silently forward-fill prices across a closed market or treat missing volume as zero. Those choices change the meaning of the result.
<!-- LEVEL-1-VERIFICATION:START -->Level 1 verification contract
The short name is not the algorithm. For this package, the reproducible identity of Volatility Regime Classifier is the selected expression, the data basis, the clock, the parameter state, and the invalid-output policy taken together.
| Contract item | Frozen rule for this topic |
|---|---|
| canonical question | Where does current realized volatility rank against a trailing reference distribution? |
| selected expression | rv_t = popstd(r_(t-n+1..t)) with r_k = C_k/C_(k-1) - 1; rank_t = count(rv_j <= rv_t for j in t-m+1..t) / m; low if rank_t <= 0.25, high if rank_t >= 0.75, else normal |
| required evidence | ordered OHLC observations, explicit lookbacks and thresholds, and pivots confirmed without future leakage |
| output clock | A state at t may use only observations available through t; confirmed swings retain their confirmation timestamp and are never relabeled as known at the pivot bar. |
| invalid states | non-finite, misordered, future-dated, basis-mixed, unsupported parameters, insufficient warm-up, or undefined denominator/state |
| interpretation boundary | Regime labels compress a path; they are model outputs with uncertainty, not permanent market truths. |
The displayed expression is the package's frozen publication convention. Names used by other platforms are not sufficient evidence of formula parity; compare coefficients, windows, equality rules, seeds, and output clocks.
This table separates four things that are often blurred together: cited lineage, the repository's explicit convention, synthetic example inputs, and the interpretation you draw from the result. Read the full definition contract, data contract, and verification fixture before implementing a variant.
<!-- LEVEL-1-VERIFICATION:END -->Calculate it step by step
- Declare the measurement. Name the source price or OHLC fields, interval, session, adjustment basis, parameters, seed, and equality rules.
- Validate before calculating. Check order, finiteness, duplicates, eligibility, and minimum history. A clean error is more informative than a plausible zero.
- Build intermediates causally. Rolling extrema, averages, ranges, pivots, returns, phase states, and volume sums may use only information available now.
- Apply the formula without display rounding. Keep numerator, denominator, weights, state, and boundary comparisons available for audit.
- Emit a structured result. Return the value plus
ready,state, window boundaries, parameters, and reason codes. - Interpret the measurement—not a story. Explain what changed in the input and intermediate state before attaching a market narrative.
A worked numerical example
Use fourteen synthetic closes with parameters.period = 3 and
parameters.rank_period = 4, so the first label lands at index 3 + 4 - 1 = 6.
Volatilities are shown rounded to seven decimals; the implementation carries full
precision.
| t | close | volatility | rank | regime |
|---|---|---|---|---|
| 0 | 100 | null | — | null |
| 1 | 100.5 | null | — | null |
| 2 | 100 | null | — | null |
| 3 | 100.5 | 0.0047023 | — | null |
| 4 | 100 | 0.0047023 | — | null |
| 5 | 104 | 0.0192852 | — | null |
| 6 | 96 | 0.0481552 | 4/4 = 1.00 | high |
| 7 | 105 | 0.0712502 | 4/4 = 1.00 | high |
| 8 | 95 | 0.0851021 | 4/4 = 1.00 | high |
| 9 | 100 | 0.0811533 | 3/4 = 0.75 | high |
| 10 | 100.5 | 0.0616278 | 1/4 = 0.25 | low |
| 11 | 100 | 0.0251370 | 1/4 = 0.25 | low |
| 12 | 100.5 | 0.0047023 | 1/4 = 0.25 | low |
| 13 | 100 | 0.0047023 | 2/4 = 0.50 | normal |
Three rows are worth reading closely.
At t = 9 the volatility has already started falling, but three of the four
readings in the rank window are still at or below it, so rank = 0.75 and the
inclusive upper threshold still returns high. At t = 10 only the current reading
is at or below itself, so rank = 0.25 and the inclusive lower threshold returns
low on the very first bar it can.
At t = 13 the volatility is exactly equal to the reading at t = 12. Because the
rank counts values less than or equal to the current one, both are counted, the
rank rises to 0.50, and the label moves to normal without any change in the
underlying number. A package that ranked strictly (< rather than <=) would still
report low here.
The regime label is a position within a trailing distribution, not a measurement of
the market. Shorten rank_period and the same volatility path relabels itself.
Every number in that table is a synthetic teaching input or an author-derived calculation. It was chosen because you can check it with a calculator. It is not a historical security, provider observation, or backtest.
The visual below makes the audit sequence explicit. Read from input contract to intermediate state, then to the selected boundary, and only then to output.
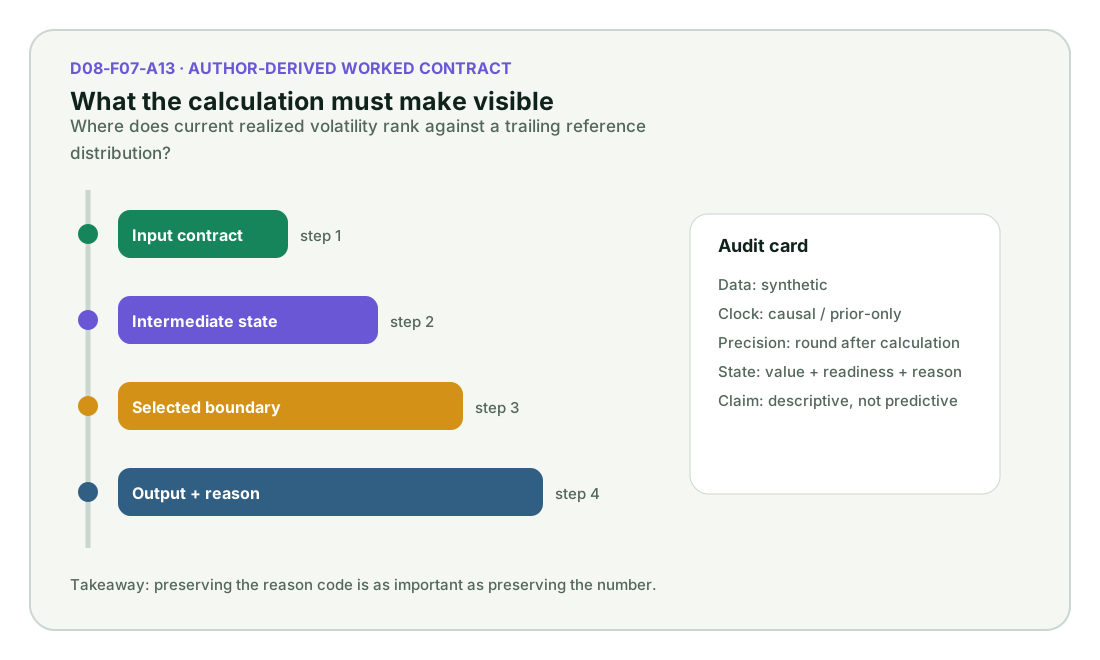
Open the worked-contract trace at full size.
Implementation blueprint
The most useful reference implementation returns diagnostics rather than one naked number. In language-neutral pseudocode:
function calculate(observations, parameters):
    contract = freeze_source_clock_basis_and_variant(parameters)
    rows = validate_sort_and_align(observations, contract)
    if rows are invalid:
        return { ready: false, state: "invalid", reason: exact_reason }
    if rows are shorter than the declared warm-up:
        return { ready: false, state: "waiting", reason: "insufficient_history" }

    intermediate = build_causal_state(rows, contract)
    if required denominator or state is undefined:
        return { ready: false, state: "undefined", diagnostics: intermediate }

    value = apply_selected_formula(intermediate, contract)
    return {
        ready: true,
        state: "calculated",
        value: value,
        parameters: contract.parameters,
        window_start: intermediate.window_start,
        window_end: intermediate.window_end,
        diagnostics: intermediate.audit_fields
    }
This package deliberately does not claim that such pseudocode is a finished Python or TypeScript implementation. A production implementation still needs independent expected values, boundary tests, shared fixtures, numerical tolerances, and parity checks in every delivered language.
Use the guided lab
Open the self-contained Volatility Regime Classifier guided lab. It begins in an informative canonical state and offers three scenarios:
- Canonical — enough valid synthetic evidence to calculate.
- Boundary — one warm-up or equality decision remains unresolved.
- Failure — invalid timing, ordering, basis, or numeric input is rejected.
Use Back and Step to expose one stage at a time. Change the declared window and notice that the lab resets dependent state. Play uses the same transition as Step; with reduced motion, Play advances exactly once. The chart is an evidence-readiness trace, not a simulated market return.
Tests that protect meaning
A strong test suite for Volatility Regime Classifier should cover more than a happy-path value:
| Test | What it protects |
|---|---|
| canonical synthetic fixture | formula, units, sign, and displayed example |
| one observation before warm-up | waiting remains distinct from zero |
| equality at every threshold | inclusive versus strict comparisons |
| zero denominator or zero range | defined null/error policy |
| NaN, infinity, duplicate, reverse order | validation before arithmetic |
| parameter minimum and maximum | rejected versus supported variants |
| split, roll, or session discontinuity | consistent basis and calendar |
| prefix replay | no later observation changes an earlier causal output |
| independent arithmetic | expected values do not call the implementation under test |
For recursive methods, also test the seed, restart behavior, long-history convergence, and a flat series. For rolling statistics, test ties and interpolation. For patterns, test one-tick boundary failures and prior-only context. For phase methods, test phase wrap, sampling regularity, and unstable-period handling.
Where implementations disagree
Two charts carrying the same title can differ for legitimate reasons:
- one uses close while another uses midpoint or typical price;
- one includes the current bar in an extremum while another uses prior-only history;
- one seeds from the first observation while another seeds from an initial average;
- one emits the earliest mathematical value while another removes an unstable period;
- one resets at an exchange session while another runs continuously;
- one treats equality as a match while another requires a strict crossing;
- one adjusts historical OHLC but not volume consistently; or
- the short label refers to materially different published formulas.
The cure is not to hunt for a universally correct screenshot. Compare contracts: source fields, coefficients, window boundaries, seed, warm-up, reset, equality, missing-data policy, and first valid index.
Compare nearby methods by the question they answer
The nearest comparison set is range, trend, volatility, entropy, and breakout classifiers under the same causal clock. Use this decision table:
| Decision | Choose Volatility Regime Classifier when… | Choose a nearby method when… |
|---|---|---|
| target feature | Where does current realized volatility rank against a trailing reference distribution? is the exact diagnostic | another method measures the feature you actually need |
| units | its raw or normalized scale is useful | cross-asset comparability needs another denominator |
| responsiveness | its selected window and smoothing fit the clock | you need a different lag/noise trade-off |
| auditability | you can publish inputs and intermediate state | a proprietary or opaque approximation cannot be validated |
| evidence | descriptive measurement is enough | a decision requires a separately validated forecast or causal model |
Neither column is automatically superior. The right method is the one whose contract matches the question and whose failure modes your system can monitor.
Practical use—and responsible limits
Use Volatility Regime Classifier as a feature, diagnostic, chart annotation, alert input, screening field, or quality-control measurement only after its availability clock is explicit. Store the parameters and reason codes beside the value so a later reviewer can reconstruct why the state changed.
Do not treat a threshold crossing as an order, a pattern match as confirmation, or a high/low oscillator reading as destiny. Regime labels compress a path; they are model outputs with uncertainty, not permanent market truths. If you want to claim association with future returns, design a point-in-time study with a frozen universe, survivorship and look-ahead controls, transaction costs, multiple-testing controls, out-of-sample evaluation, and uncertainty intervals.
Historical-example decision
Not useful for definition. A named episode would add story value but no stronger understanding of the deterministic calculation. The synthetic example is smaller, fully redistributable, and independently checkable. A later empirical companion can add real data only after identity, venue, session, adjustment basis, retrieval time, revision status, parameters, costs, biases, uncertainty, and licensing are frozen.
What to remember
- Volatility Regime Classifier asks: Where does current realized volatility rank against a trailing reference distribution?
- The selected formula is
rv_t = popstd(r_(t-n+1..t)) with r_k = C_k/C_(k-1) - 1; rank_t = count(rv_j <= rv_t for j in t-m+1..t) / m; low if rank_t <= 0.25, high if rank_t >= 0.75, else normal. - Input source, clock, basis, seed, warm-up, window, and equality policy are part of the algorithm.
- Undefined and insufficient-history states must not be converted to zero.
- The worked values are synthetic and author-derived.
- Correct calculation does not establish prediction or profitability.
You can now audit Volatility Regime Classifier from source data to interpretation. Continue with Directional Persistence and compare which assumption changes, while keeping Trend/Range Regime Classifier nearby as the preceding family reference.
Primary and authoritative references
- Technical Analysis: Modern Perspectives (CFA Institute Research Foundation) — Professional curriculum context for trend, support, resistance, indicators, and pattern interpretation.
- TA-Lib maintained source — Reference source for rolling extrema, ATR, and related primitives where applicable.
- Long-Term Storage Capacity of Reservoirs — Hurst's original rescaled-range work; modern estimators and financial interpretations require additional care.
Choose Volatility Regime Classifier deliberately
The useful choice is not “which indicator is best?” It is “which contract answers my question with the fewest hidden choices?” Use this decision table before adding the method to a chart, feature pipeline, or research notebook.
| Choice | Use it when | Verify before accepting output |
|---|---|---|
| Volatility Regime Classifier | You need the exact question and convention printed in this package. | Validate readiness, diagnostics, and the topic-specific failure state. |
| Simpler baseline | You first need an unambiguous reference from range, trend, volatility, entropy, and breakout classifiers under the same causal clock. | Prefer interpretability; record the same source, basis, clock, and window. |
| Nearby alternative | Your actual question differs in smoothing, normalization, geometry, or state semantics. | Freeze its contract separately; never swap formulas under one label. |
| No output | Inputs are missing, non-finite, misordered, basis-mixed, future-dated, or still warming up. | Return waiting, invalid, or undefined with a reason—not zero. |
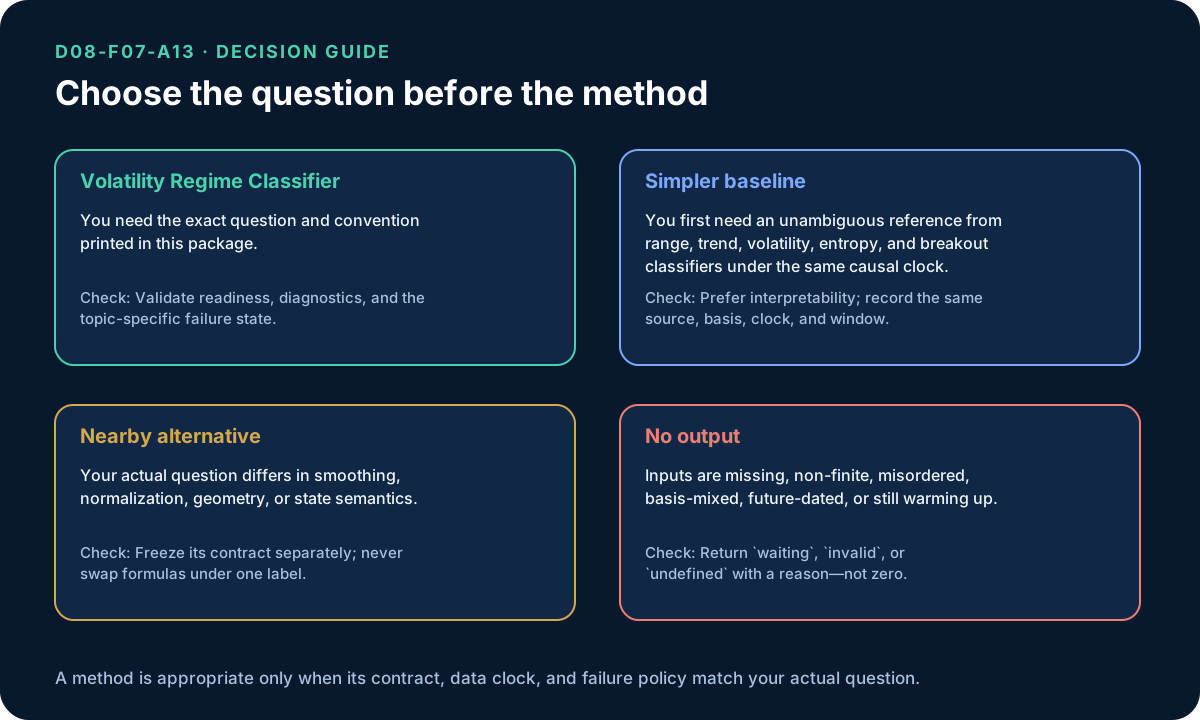
Decision takeaway: choose the selected method only when its exact measurement question matches yours. Otherwise prefer the simpler baseline, freeze a different variant, or withhold output. Open the decision guide at full size.
Learning path and related topics
- Prepare with:
D08-F07-A12. Confirm you understand the family's input basis and availability clock first. - Compare with:
D08-F07-A01,D08-F07-A02. Compare questions, not screenshots; nearby titles may use different windows, normalization, seeds, or state definitions. - Continue to:
D08-F07-A14. Carry forwardready,available_at, parameters, and diagnostics instead of forwarding a naked number. - Implementation boundary: this is a complete implementation package with Python and TypeScript entry points, topic-owned fixtures, and parity checks. The pseudocode remains a teaching blueprint for the shipped contract.
The relationship IDs are stored in metadata.yaml so the visitor layer can resolve stable cards when these article-only topics later clear the complete-package publishing gate.
Executable reference package
This topic now includes a causal reference calculation, a 96-observation synthetic multi-regime fixture, a flat/zero-volume boundary fixture, Python tests, and a Node/TypeScript API parity test. Synthetic observations are teaching data, not issuer history or evidence of predictive value. Run python tests/test_reference.py and node --experimental-strip-types tests/reference.test.ts from this topic directory.
Rendered from the canonical Mermaid sources linked by this article.
Volatility Regime Classifier calculation flow
Purpose: keep validation, timing, calculation, and interpretation separate.
Takeaway: an output is publishable only when its input clock and selected convention are visible.
Volatility Regime Classifier readiness and evidence states
Takeaway: waiting, rejected, and calculated are different states; a system should not coerce them into zero.
ReferencesPrimary sources and evidence notesExpand the source trail, evidence role, and limitations behind the engineering choices.
Expand the source trail, evidence role, and limitations behind the engineering choices.
S1 — Technical Analysis: Modern Perspectives (CFA Institute Research Foundation)
- Organization or authors: Gordon Scott, Michael Carr and Mark Cremonie; CFA Institute Research Foundation
- Source type: Professional-body literature review
- Publication/effective date: CFA Institute Research Foundation Literature Review, 2016
- Version/accessed: accessed 2026-08-11
- URL: Technical Analysis: Modern Perspectives (CFA Institute Research Foundation)
- Jurisdiction/applicability: technical education and reproducible software convention
- Supports: the professional-body account of technical-analysis practice that places Volatility Regime Classifier in context
- Limitations: Professional curriculum context for trend, support, resistance, indicators, and pattern interpretation.
S2 — TA-Lib maintained source
- Organization or authors: TA-Lib project contributors
- Source type: Maintained open-source reference implementation
- Publication/effective date: Undated living repository, main branch
- Version/accessed: accessed 2026-08-11
- URL: TA-Lib maintained source
- Jurisdiction/applicability: technical education and reproducible software convention
- Supports: the maintained reference implementation whose naming, parameter defaults and calculation order Volatility Regime Classifier is compared against
- Limitations: Reference source for rolling extrema, ATR, and related primitives where applicable.
S3 — Long-Term Storage Capacity of Reservoirs
- Organization or authors: H. E. Hurst
- Source type: Peer-reviewed original research
- Publication/effective date: Transactions of the American Society of Civil Engineers, volume 116, pages 770-799, 1951
- Version/accessed: accessed 2026-08-11
- URL: Long-Term Storage Capacity of Reservoirs
- Jurisdiction/applicability: technical education and reproducible software convention
- Supports: the original rescaled-range analysis in the lineage behind Volatility Regime Classifier
- Limitations: Hurst's original rescaled-range work; modern estimators and financial interpretations require additional care.
Evidence decision
The package uses synthetic teaching inputs and author-derived arithmetic. A named security example is not useful for defining Volatility Regime Classifier because it would add market story without improving the deterministic contract. A later empirical article would need licensed point-in-time data, instrument and venue identity, session and adjustment basis, retrieval time, corrections, parameter version, costs, bias controls, uncertainty, and redistribution permission.
<!-- LEVEL-1-EVIDENCE:START -->Level 1 evidence map
| Claim class | Support | Publication boundary |
|---|---|---|
| lineage and maintained terminology | S1–S3 above | source naming does not establish universal formula parity |
| selected mathematical convention | research/DEFINITION-CONTRACT.md | explicit repository choice unless an exact primary formula source is named |
| numerical teaching values | article worked example | synthetic inputs and author-derived arithmetic, not provider facts |
| causal and invalid-state policy | data-contract/CONTRACT.md | safety and reproducibility policy, not a performance claim |
| historical case | not-useful-for-definition | requires a separately evidenced point-in-time study before publication |
Reviewed 2026-08-11. No current market fact, named security result, forecast, or profitability claim is made.
<!-- LEVEL-1-EVIDENCE:END -->Full dependency-light reference implementations in both supported languages.
/** Dependency-free native TypeScript entry point for D08-F07-A13: Volatility Regime Classifier. */
import { volatilityRegimeClassifier as nativeVolatilityRegimeClassifier, type TopicInput, type TopicResult } from "../../../../../../shared/missing_152/typescript/referenceRuntime.ts";

export const TOPIC_ID = "D08-F07-A13";
export const TITLE = "Volatility Regime Classifier";

export function volatilityRegimeClassifier(input: TopicInput): TopicResult {
  return nativeVolatilityRegimeClassifier(input);
}
The embedded lab now expands to its full document height, keeping the article as the only scroll surface.