
 By Islam Baraka
Domain: D00 — Financial Mathematics, Statistics, and Data Foundations
Family: D00-F01 — Mathematical Language and Quantitative Reasoning
Audience: a curious beginner who may not have studied finance or programming
Delivery: plain-language lesson, hand-worked arithmetic, and a small interactive lab
The one-sentence idea
Compare amounts fairly by making the denominator and the unit visible.
Why this matters in money
A raw number can hide scale. Saying “SAR 350 of expense” means little until we compare it with revenue, people, shares, or time. Ratios and rates make that comparison readable.
What you will be able to do
- separate a ratio from a percentage
- calculate a rate per unit
- explain why the denominator changes the story
What you need first
- division and multiplication
- A01 variables and units
You do not need to program for this lesson. We use ordinary words and small numbers first. Later domains may show implementation details after the idea is comfortable.
Words to know
| Term | In simple words |
|---|---|
| Ratio | A comparison of one amount with another, such as 3 to 5. |
| Proportion | A statement that two ratios are equal. |
| Rate | A comparison that includes a unit, such as SAR 20 per customer. |
| Percentage | A ratio written per 100. |
Scope and simple boundary
We use financial margins and simple per-unit rates. Choice of a business KPI or peer denominator belongs to the later topic that owns that decision.
Definition contract
| Decision | Our simple choice | What we do not claim | Check |
|---|---|---|---|
| Denominator | State what the comparison is relative to. | Do not call 350/500 a universal measure without naming revenue as the denominator. | The output label says expense as a share of revenue. |
| Percentage | Multiply a ratio by 100 to express it per 100. | Do not multiply by 100 twice. | 350/500 = 0.70 = 70%. |
| Rate | Keep the unit after division. | A per-customer amount is not a percentage. | SAR 350/25 customers = SAR 14 per customer. |
Input contract
| Name | Kind | Unit | Empty? | Meaning |
|---|---|---|---|---|
| revenue | money | SAR | No | The comparison base in this example. |
| expenses | money | SAR | No | Money spent during the same period. |
| customers | count | people | No | A count for the per-unit rate. |
All values in one example must use the same time period, currency, and scale unless the lesson explicitly shows a conversion. A missing or impossible input is a question to resolve, not a number to guess.
Output contract
| Output | Kind | Unit | Meaning | Safety rule |
|---|---|---|---|---|
| expense_ratio | ratio | unitless | Expenses divided by revenue. | Revenue must be non-zero. |
| expense_percent | percentage | % | Expense ratio written per 100. | 0% to 100% for non-negative expenses below revenue. |
| cost_per_customer | rate | SAR/customer | Expenses divided by customers. | Customer count must be positive. |
The rule in everyday language
expense share = expenses / revenue; cost per customer = expenses / customers
Think of the rule as a sentence. Say what each number means before you put it into the sentence.
Symbol table
| Name | Meaning | Unit |
|---|---|---|
| revenue | comparison base | SAR |
| expenses | amount being compared | SAR |
| customers | number of customers | count |
| share | expense divided by revenue | % |
Four small steps
- Say the comparison in words before dividing.
- Check that both amounts cover the same period and currency.
- Divide the amount being studied by the chosen base.
- Add the unit back: percent, SAR per customer, or another honest label.
Worked example (synthetic teaching numbers)
Revenue is SAR 500 and expenses are SAR 350. Expense share = 350 / 500 = 0.70 = 70%. If 25 customers created those expenses, cost per customer = 350 / 25 = SAR 14. The same SAR 350 has two different meanings because the denominators differ.
Independent check
If revenue is zero, expense percentage is not zero; it is undefined until a meaningful base is supplied. A blank denominator is a warning, not an invitation to guess.
The numbers above are synthetic and author-derived for learning. They are not an observation about a named company, market, customer, or investment.
Simple playground
Open the small guided lab. Choose a number, press Step, and read the explanation under the result. The lab is designed to show one idea at a time, not to replace the lesson.
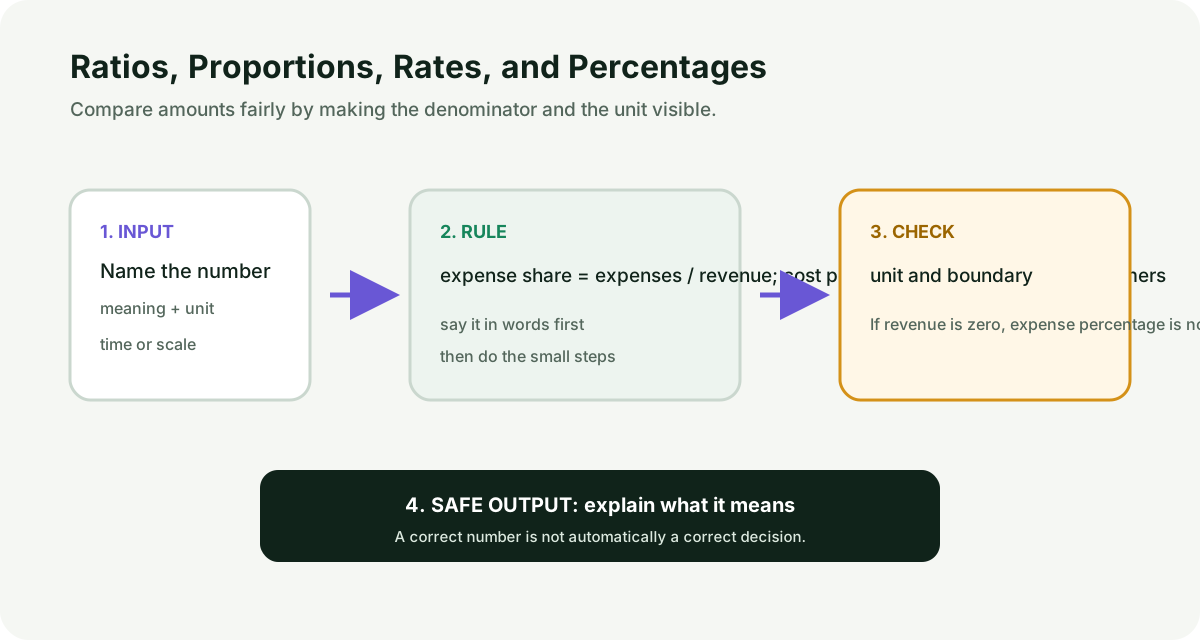
What to notice: the input, the rule, the check, and the safe interpretation are shown in that order. Open the full-size visual.
Where this is useful
- margins and expense shares
- cost per customer
- position size as a share of a portfolio
What this does not tell you
A ratio describes a relationship. It does not by itself explain quality, cause, fairness, or future performance.
This is educational content, not investment, tax, legal, accounting, or regulatory advice. A simple calculation can be correct and still be the wrong calculation for a real decision.
Historical-example decision
Not useful for this lesson. A named company would add a story but would not teach the primitive more clearly than the small synthetic numbers above. A real case would also need a verified entity, period, unit, and publication right. The lesson therefore keeps its arithmetic transparent and synthetic.
Related lessons
Evidence boundary
The plain-language definitions and measurement cautions are supported by NIST. The formula wording, examples, and lab behavior are author-derived teaching choices. See the claim ledger and references for the boundary.
Optional verification implementation
You do not need code to learn this lesson. The package now includes matching Python and TypeScript verification façades, a shared worked-example fixture, and parity tests. They reproduce the lesson’s frozen rule and remain optional for nontechnical learners.
The fixture carries the lesson's own numbers. The shared engine uses generic
field names, so the mapping is: whole is revenue 500, part is expenses 350,
and elapsed is the count of 25 customers the amount is spread over. The
returned ratio is 0.7, percentage is 70, and ratePerPeriod is 14, which
are the three results the worked example reaches by hand. The engine also
validates a values array before any F01 branch runs; this topic does not use
it, so the fixture carries a placeholder list.
Enhancement studio: draw, compare, explain
This additive studio does not replace the beginner lesson above. It gives you two more drawings, a decision comparison, and short practice prompts so you can explain the idea without copying a formula or writing code.
Drawing 1 — name, apply, check
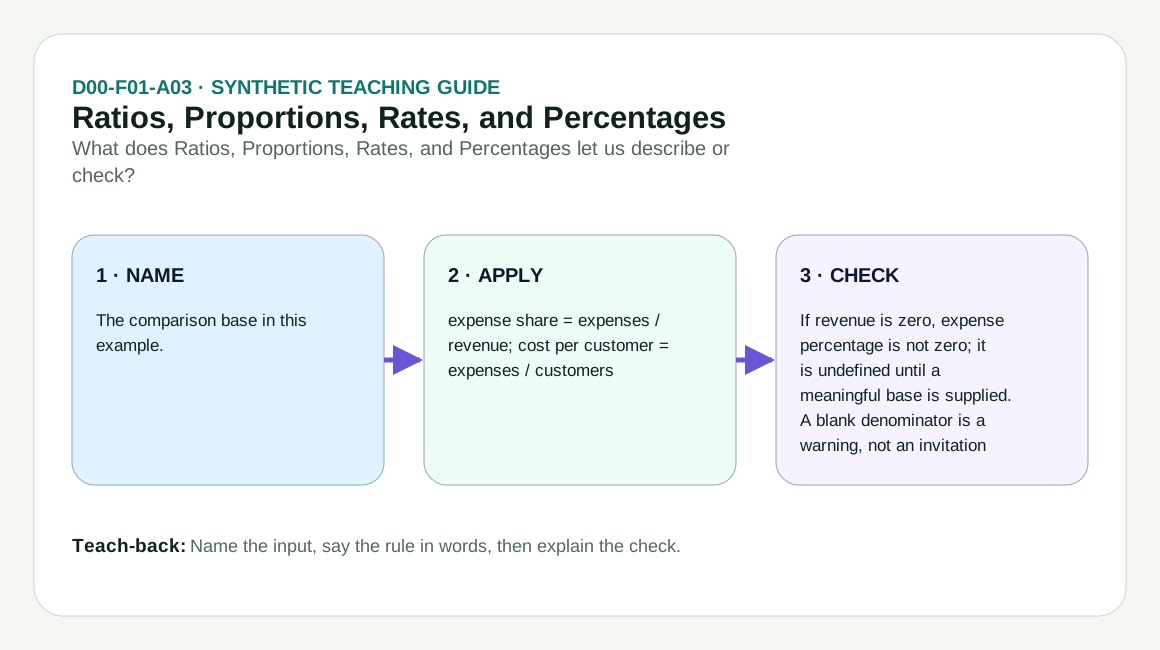
Read left to right: name what the data means, apply the narrow lesson rule, then use an independent check. Open the full-size concept anatomy.
Choose the right idea
| Decision | This lesson | Closest next or comparison | Why the difference matters |
|---|---|---|---|
| Main question | Compare amounts fairly by making the denominator and the unit visible. | Percentage Change, Percentage Points, and Basis Points | Choose the question before choosing the arithmetic. |
| Safe rule | expense share = expenses / revenue; cost per customer = expenses / customers | Uses its own input and boundary contract. | Neighboring lessons can use the same numbers but answer different questions. |
| Required check | If revenue is zero, expense percentage is not zero; it is undefined until a meaningful base is supplied. A blank denominator is a warning, not an invitation to guess. | Re-check its own unit, time, denominator, or schema. | A correct answer to the wrong question is still wrong. |
| Stop condition | Do not call 350/500 a universal measure without naming revenue as the denominator. | Move only when its prerequisites are satisfied. | Unknown meaning is a reason to pause, not to guess. |
Drawing 2 — common-mistake clinic
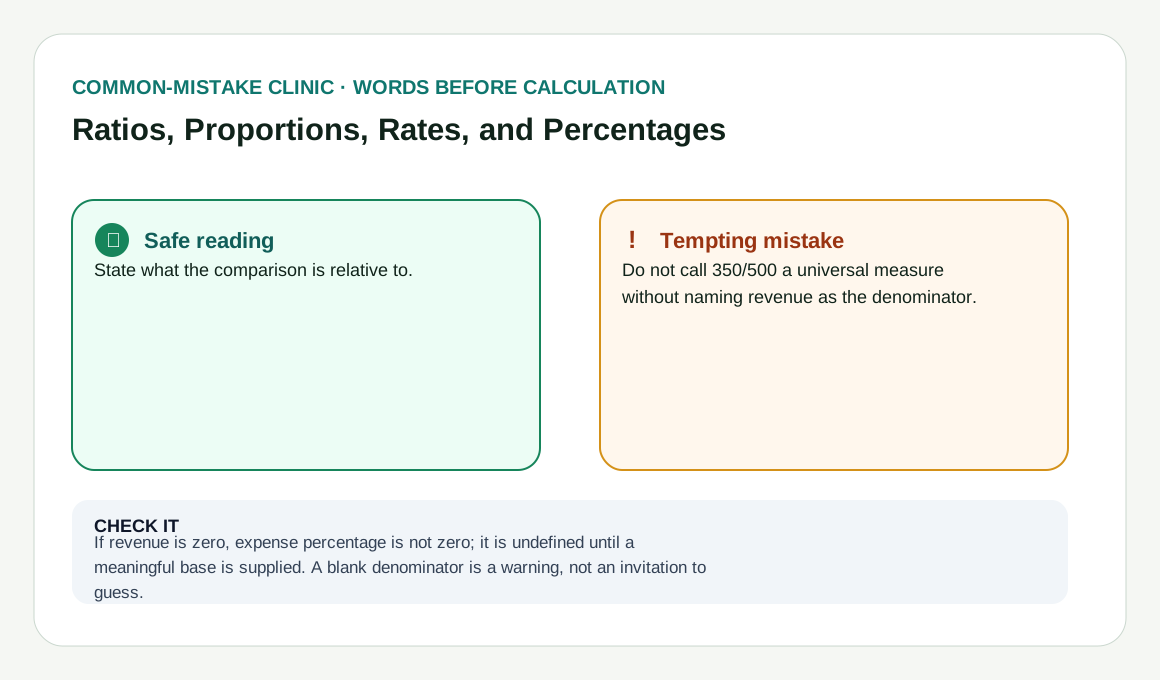
The left side states the safe interpretation; the right side shows the mistake that often produces a believable but misleading result. Open the full-size mistake comparison.
Explain it back without code
- Name it: What does the first input or observation mean?
Answer: The comparison base in this example. - Choose it: Which rule belongs to this question?
Answer: expense share = expenses / revenue; cost per customer = expenses / customers - Challenge it: What check could make you stop?
Answer: If revenue is zero, expense percentage is not zero; it is undefined until a meaningful base is supplied. A blank denominator is a warning, not an invitation to guess.
If your explanation leaves out the unit, period, denominator, grain, or availability time that the lesson needs, it is not complete yet.
Related concepts and learning handoff
- Governed glossary: Ratio, Proportion, Rate, Percentage. Browse the full financial glossary when a term is unfamiliar.
- Continue with: Percentage Change, Percentage Points, and Basis Points.
- Evidence boundary: all displayed numbers remain synthetic teaching data; the drawings do not claim a market observation, forecast, or investment result.
Rendered from the canonical Mermaid sources linked by this article.
Ratios, Proportions, Rates, and Percentages — four-part map
This diagram shows the learner's path from a named input to a safe explanation.
Takeaway: the check is not an afterthought. It tells the learner whether the answer belongs to the question that was asked.
ReferencesPrimary sources and evidence notesExpand the source trail, evidence role, and limitations behind the engineering choices.
Expand the source trail, evidence role, and limitations behind the engineering choices.
The family uses a small shared evidence set. Each source has a limited role; the examples and lab are clearly author-derived synthetic teaching material.
NIST — NIST/SEMATECH e-Handbook of Statistical Methods
- Organization or authors: NIST/SEMATECH
- Source type: Official statistical handbook
- Publication or effective date: 2022 current web edition
- Version: current web edition accessed for this build
- URL: https://www.itl.nist.gov/div898/handbook/
- Accessed: 2026-08-10
- Jurisdiction: general educational or measurement context
- Supports: Definitions, careful measurement language, and the difference between a calculation and a claim.
- Limitations: It does not choose this family's teaching examples or financial conventions.
Author-derived and synthetic boundary
The formulas are standard classroom definitions expressed in plain language. The worked values, visual labels, and playground scenarios are synthetic teaching inputs created for this package. They do not establish a company fact, market outcome, or investment result.
Full dependency-light reference implementations in both supported languages.
import { runTopic as runD00Topic, type D00Input, type D00Output } from "../../../../shared/typescript/d00Engine.ts";

/** Run the canonical D00-F01-A03 calculation. */
export function ratiosProportionsRatesAndPercentages(input: D00Input): D00Output {
  return runD00Topic("D00-F01-A03", input);
}
The embedded lab now expands to its full document height, keeping the article as the only scroll surface.