
The governed definitions this build depends on. Read them first if a term is unfamiliar.
- PrimaryOutlierAn outlier is an observation that is unusually distant or inconsistent under a specified comparison model.
- ImportantMissing ValueA missing value indicates that the expected information is unavailable, unobserved, inapplicable, or withheld under a stated data contract.
- ImportantNumerical ToleranceNumerical tolerance is a declared bound used to decide when two numeric results are acceptably close for a specific comparison.
- ImportantPrecisionPrecision describes the fineness or number of digits with which a value or timestamp is represented or computed.
- MentionedImputationImputation is the governed estimation or substitution of values where observations are missing.
Practical promise. Build a robust, auditable review queue for one comparable batch without letting its most extreme values set the scale.
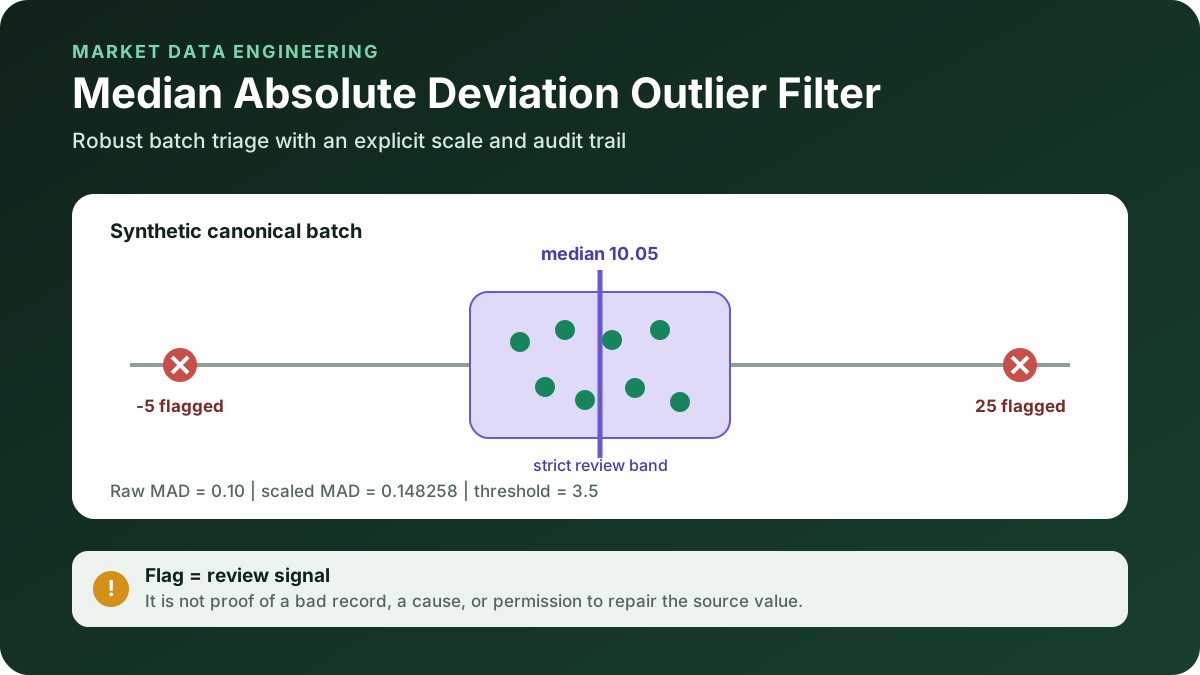
A market-data team often needs to find values that deserve attention before deciding what happened. A close far from its peers could be a unit error, an adjustment mismatch, a corporate action, a legitimate market move, or simply a member of a different population. The median absolute deviation (MAD) helps with the first step: robust statistical triage.
This article is deliberately strict about that boundary. The algorithm flags unusual distance. It does not prove that a record is wrong, infer a cause, or replace the source value.
The question this algorithm answers
For one declared, comparable batch:
Is this finite observation farther from the batch median than the configured number of scaled MAD units?
"Comparable" is part of the algorithm contract. Partition records before scoring by the unit, field, timestamp basis, price-adjustment basis, and economic population that make distance meaningful. Combining USD and JPY prices or adjusted and unadjusted closes can produce a mathematically valid but operationally useless result.
Unlike a Hampel filter, this package is global and batch-based. Observation order is preserved for identity but does not change the median. It is not a causal rolling detector.
Raw MAD and scaled MAD are different quantities
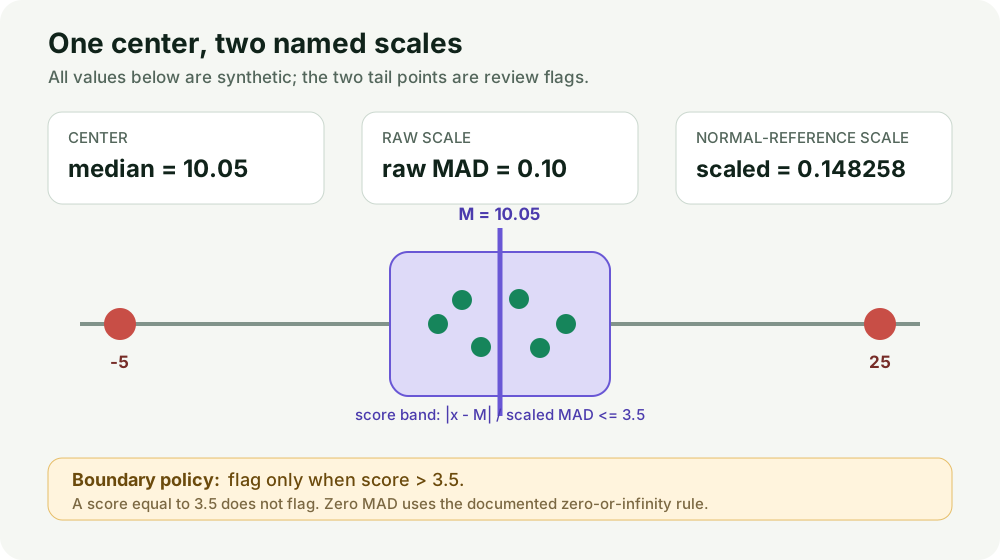
Let be the finite, nonmissing values in one partition. The center is
The raw median absolute deviation is
Raw MAD has the same unit as the source values. The NIST/SEMATECH statistics handbook uses this definition and explains that tail values exert less influence on MAD than on squared-deviation scale estimates.
NIST Dataplot separately defines a normal-reference scaled form as raw MAD divided by 0.6745. This package therefore names the two quantities:
The default is a calibration convention. Under an approximately normal distribution, scaled MAD is comparable to standard deviation. It is not a claim that market observations are normally distributed. Set when a raw-MAD score is desired, and always store the chosen scale with the result.
The package's nonnegative robust distance score is
It flags only when
The default threshold is , an engineering policy in this package rather than a universal law. Equality is strict: a score exactly equal to the threshold does not flag.
Worked synthetic example
The shared fixture contains twelve finite values and one missing position:
10, 10.1, 9.9, 10.2, 10.1, 9.8, 10, 10.2, 10.1, 10, 25, missing, -5
Its median is 10.05 and raw MAD is 0.10. With default normal-reference scaling, scaled MAD is approximately 0.148258.
| Position | Value | Approximate score | Result |
|---|---|---|---|
| 10 | 25 | 100.83775 | Flagged for review |
| 11 | Missing | No score | Preserved, not flagged |
| 12 | -5 | 101.51225 | Flagged for review |
The two flags are fixture expectations, not verified real-world errors.
Boundary behavior is part of the definition
Missing and nonfinite values
Missing values are excluded from the median and MAD, but their original positions remain in output with no score and no flag. In contrast, NaN and positive or negative infinity are rejected. Treating nonfinite values as ordinary missing data would hide an upstream numerical failure.
Minimum sample
The default minimum is three finite observations. A smaller batch returns insufficient_sample; it does not invent a center, score, or flag. A production owner may choose a larger minimum based on group stability, but that choice belongs in versioned configuration.
Zero MAD
Rounded, discrete, or flat batches often have raw MAD equal to zero. Rather than divide by zero, this package uses an explicit rule:
Every departure from the flat majority is therefore visible. That sensitivity is useful for triage but can over-flag coarse tick or rounded data. The diagnostic raw_mad = 0 should travel with the flag.
Auditable algorithm flow
The last node matters most operationally: detection and repair are separate workflows. A repair process needs additional evidence and an explicit authorization policy.
Explore the decision instead of trusting a final count
Open the interactive MAD laboratory. It starts with a useful canonical state and provides four named scenarios:
- Canonical robust triage shows 48 comparable finite synthetic observations plus one missing position.
- Zero MAD exposes the zero-or-infinity policy.
- Mean/std comparison shows how tail values can expand a classical scale while the robust center and scale behave differently.
- Failure: insufficient sample suppresses scores and flags.
Use Back and Step to inspect one record at a time, change the scale convention, and move the threshold. Reset deterministically restores each scenario. The lab labels every dataset as synthetic.
Python and TypeScript implementation
Both implementations expose the same four policy parameters:
result = mad_outliers(
    values,
    threshold=3.5,
    scale=1 / 0.6745,
    minimum_samples=3,
)
The TypeScript call is equivalent:
const result = madOutliers(values, 3.5, 1 / 0.6745, 3);
Each result includes the status, sample counts, median, raw MAD, scaled MAD, exact scale and threshold, plus position-level scores and flags. That output is sufficient to reconstruct a classification without mutating raw data.
What the tests prove
The shared fixture locks Python and TypeScript to the same canonical, strict-equality, zero-MAD, and insufficient-sample outcomes. Additional tests cover:
- odd and even medians;
- missing-position retention;
- normal-reference and raw scaling;
- invalid thresholds, scales, minimum samples, booleans, and nonfinite values;
- the damage caused by mixing incomparable groups; and
- a 128-record synthetic cross-section with six declared injected extremes.
Passing these tests proves definition-level consistency. It does not prove that a production grouping or threshold is economically appropriate, and it says nothing about predictive or trading value.
Why mean/std and median/MAD can disagree
Mean and sample standard deviation respond to the magnitudes of tail observations. Median and MAD depend on ranks near the center. With several synthetic tail values, the mean can shift and standard deviation can expand enough that a fixed standard-deviation rule and a fixed scaled-MAD rule return different review sets.
That difference is informative, not a verdict. A heavy-tailed but legitimate population may naturally contain more robust-score flags. Conversely, a contaminated majority can move the median itself. The lab comparison is synthetic so it demonstrates mechanics without pretending that a statistical disagreement establishes a historical market-data error.
Production interpretation and misuse
For every flag, retain:
- the source record and lineage;
- grouping keys and batch timestamp;
- raw and scaled MAD;
- scale, threshold, equality policy, and minimum sample;
- missing and zero-MAD diagnostics; and
- the detector version.
Then investigate with evidence suited to the suspected cause: reference-data terms, corporate-action records, venue or issuer notices, adjustment conventions, and independent source comparison. A detector cannot turn "unusual" into "incorrect" on its own.
Summary
Global MAD classification is valuable when its conventions are visible. Define one comparable batch, report raw and scaled MAD separately, use an explicit strict threshold, preserve missing positions, reject nonfinite values, handle zero MAD deliberately, and return no score when the sample is insufficient. Most importantly, keep the flag separate from proof and repair.
Continue with Stale-Quote Detector to classify freshness from timestamp evidence rather than numerical distance, or revisit Hampel Bad-Tick Filter for a local moving-window version of median/MAD logic.
Primary references and asset map
Source roles, dates, and limitations are recorded in REFERENCES.md.
| Asset | Teaching role | Source |
|---|---|---|
| Article overview | Flag-versus-proof boundary | ../visuals/static/article-hero.svg |
| Exact geometry | Raw/scaled MAD and strict threshold | ../visuals/static/mad-geometry.svg |
| Interactive laboratory | Parameter, zero-MAD, comparison, and failure scenarios | ../visuals/animated/playground.html |
Rendered from the canonical Mermaid sources linked by this article.
Global MAD classification flow
This flow makes the partition, minimum-sample, zero-MAD, and non-repair decisions visible.
Takeaway: the detector classifies one declared group. It does not prove causation or repair the record.
ReferencesPrimary sources and evidence notesExpand the source trail, evidence role, and limitations behind the engineering choices.
Expand the source trail, evidence role, and limitations behind the engineering choices.
Accessed 2026-07-22. The public examples are synthetic and do not use licensed market-data payloads.
NIST-SCALE - Measures of Scale
- Organization or authors: NIST/SEMATECH
- Source type: Official statistical handbook
- Publication or effective date: Maintained e-Handbook
- Version: Section 1.3.5.6, current at access
- URL or DOI: https://www.itl.nist.gov/div898/handbook/eda/section3/eda356.htm
- Accessed: 2026-07-22
- Jurisdiction: General statistical guidance
- Supports: Raw MAD definition; comparison of tail influence for variance, standard deviation, and MAD; distribution-sensitive choice of scale estimator.
- Limitations: Does not prescribe this package's threshold, equality, missing-value, minimum-sample, zero-MAD, grouping, or repair policy.
NIST-DATAPLOT - Median Absolute Deviation
- Organization or authors: National Institute of Standards and Technology
- Source type: Official software reference
- Publication or effective date: 2016-04-11
- Version: Dataplot reference page, last updated 2016-04-11
- URL or DOI: https://www.itl.nist.gov/div898/software/dataplot/refman2/auxillar/mad.htm
- Accessed: 2026-07-22
- Jurisdiction: General statistical software
- Supports: Explicit distinction between raw MAD and scaled MAD; scaled definition ; approximate normal-reference interpretation.
- Limitations: Dataplot syntax is not the package API, and normal-reference scaling does not establish normality for market data.
HAMPEL-1974 - The Influence Curve and Its Role in Robust Estimation
- Organization or authors: Frank R. Hampel
- Source type: Original peer-reviewed paper
- Publication or effective date: 1974
- Version: Journal of the American Statistical Association, 69(346), 383-393
- URL or DOI: https://doi.org/10.1080/01621459.1974.10482962
- Accessed: 2026-07-22
- Jurisdiction: General statistical methodology
- Supports: Robust-estimation background and influence-function framework.
- Limitations: Does not dictate the package's 3.5 threshold or establish that a flagged financial observation is erroneous.
Package-policy classification
The following are implementation choices, not sourced universal definitions: strict score > threshold, default threshold 3.5, minimum sample 3, missing-position retention, nonfinite rejection, and the zero-MAD zero/infinity rule. They are documented and tested so a caller can replace them deliberately rather than inherit them invisibly.
Full dependency-light reference implementations in both supported languages.
/** Auditable global MAD classifier. It flags; it never repairs. */

export const NORMAL_CONSISTENCY_SCALE = 1 / 0.6745;

export type MadPoint = {
  index: number;
  value: number | null;
  score: number | null;
  outlier: boolean;
};

export type MadResult = {
  status: "ok" | "insufficient_sample";
  valid_count: number;
  minimum_samples: number;
  median: number | null;
  raw_mad: number | null;
  scaled_mad: number | null;
  scale: number;
  threshold: number;
  points: MadPoint[];
};

function median(values: number[]): number {
  const sorted = [...values].sort((a, b) => a - b);
  const middle = Math.floor(sorted.length / 2);
  return sorted.length % 2 === 1
    ? sorted[middle]
    : (sorted[middle - 1] + sorted[middle]) / 2;
}

export function madOutliers(
  values: (number | null)[],
  threshold = 3.5,
  scale = NORMAL_CONSISTENCY_SCALE,
  minimumSamples = 3,
): MadResult {
  if (!Number.isFinite(threshold) || threshold <= 0) {
    throw new Error("threshold must be finite and positive");
  }
  if (!Number.isFinite(scale) || scale <= 0) {
    throw new Error("scale must be finite and positive");
  }
  if (!Number.isInteger(minimumSamples) || minimumSamples < 1) {
    throw new Error("minimum_samples must be a positive integer");
  }
  if (values.some((value) => value !== null && !Number.isFinite(value))) {
    throw new Error("values must be finite numbers or null");
  }

  const clean = values.filter((value): value is number => value !== null);
  if (clean.length < minimumSamples) {
    return {
      status: "insufficient_sample",
      valid_count: clean.length,
      minimum_samples: minimumSamples,
      median: null,
      raw_mad: null,
      scaled_mad: null,
      scale,
      threshold,
      points: values.map((value, index) => ({index, value, score: null, outlier: false})),
    };
  }

  const center = median(clean);
  const rawMad = median(clean.map((value) => Math.abs(value - center)));
  const scaledMad = scale * rawMad;
  const points = values.map((value, index): MadPoint => {
    if (value === null) return {index, value, score: null, outlier: false};
    const deviation = Math.abs(value - center);
    const score = rawMad === 0 ? (deviation > 0 ? Infinity : 0) : deviation / scaledMad;
    return {index, value, score, outlier: score > threshold};
  });

  return {
    status: "ok",
    valid_count: clean.length,
    minimum_samples: minimumSamples,
    median: center,
    raw_mad: rawMad,
    scaled_mad: scaledMad,
    scale,
    threshold,
    points,
  };
}
The embedded lab now expands to its full document height, keeping the article as the only scroll surface.