
 By Islam Baraka
The governed definitions this build depends on. Read them first if a term is unfamiliar.
- PrimaryBreadth DivergenceBreadth Divergence is a rule-defined disagreement between a price trend and a market-breadth trend.
- PrerequisiteBreadth TrendBreadth Trend is the direction and structure of a chosen market-breadth measure under a specified trend rule.
- PrerequisiteMarket BreadthMarket breadth describes how widely a market movement is shared across its eligible securities.
- PrerequisitePrice TrendPrice Trend is the direction and structure of price movement under a specified trend rule and horizon.
- ImportantEvent TimeEvent time is the timestamp assigned to when a market or business event occurred at its source.
- ImportantTrend ParticipationTrend Participation describes how widely a directional trend is shared across an eligible security universe.
The hidden decision
Divergence is easy to draw after the fact; the engineering challenge is proving what was knowable, on which date, and in which breadth units.
Breadth-Divergence Detector answers one bounded question: has a causally confirmed price pivot improved while breadth at the matched pivot deteriorated, or vice versa? Its value is not a prediction. Its value is an auditable state whose inputs, time, units, and failure conditions are visible.
By the end, you will be able to calculate the method, reproduce its synthetic case, inspect its implementation trace, and decide when the output must be withheld.
Build the mental model
Confirm price pivots only after right-side bars arrive, sample breadth on those exact pivot dates, and compare price change with breadth-point separation normalized by a declared positive scale.
A visual disagreement is retrospective. This detector owns pivot windows, aligned dates, a positive breadth scale, minimum separations, and the later bar when the second pivot becomes knowable.
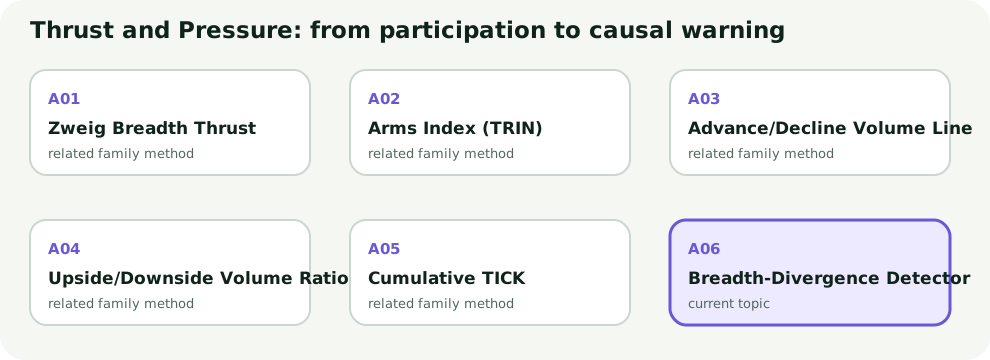
The highlighted family card is a scope boundary. Count breadth, volume composition, recursive pressure, intraday sampling, and causal divergence can all produce lines, but their units and state memories are not interchangeable.
Freeze the contract before calculating
The selected formulation is:
Use aligned price-pivot dates, two bars on each side, 1% minimum price separation, and 5 normalized breadth points using an explicit positive breadth scale. Publication invariant: The event time is the second pivot's confirmation date, never its earlier pivot date; the breadth scale must be positive and fixed for the compared series.
The input table in the canonical README defines row fields and units. The parameter table distinguishes a sourced method from package choices such as equality behavior, seed, zero policy, sampling grid, normalized breadth scale, and event timestamp.
Advance/Decline Indicator supports this bounded source role: a higher price high paired with a lower breadth high, or the inverse at lows, is commonly described as divergence. It does not override the limitations recorded in REFERENCES.md, and it does not establish historical performance.
Reproduce the synthetic result
Every observation below is synthetic. The arithmetic is author-derived:
| Diagnostic | Arithmetic | Result |
|---|---|---|
| Price change | (116 − 110) / 110 | 0.054545 = 5.4545% |
| Breadth separation | (520 − 650) / 1000 | -0.130000 = -13.00 normalized points |
| Price rule | 0.054545 ≥ 0.010000 | pass |
| Breadth rule | -0.130000 ≤ −0.050000 | pass |
| Causal timestamp | second pivot 2026-02-05 + two right bars | 2026-02-09 |
Scaling all breadth values and the declared breadth_scale by the same positive factor leaves −0.130000 unchanged. That is the unit-invariance the former near-zero denominator could not provide.
The expected output is:
{
  "status": "bearish",
  "first_pivot_date": "2026-01-19",
  "second_pivot_date": "2026-02-05",
  "confirmation_date": "2026-02-09",
  "price_change": 0.05454545454545454,
  "breadth_separation": -0.13
}
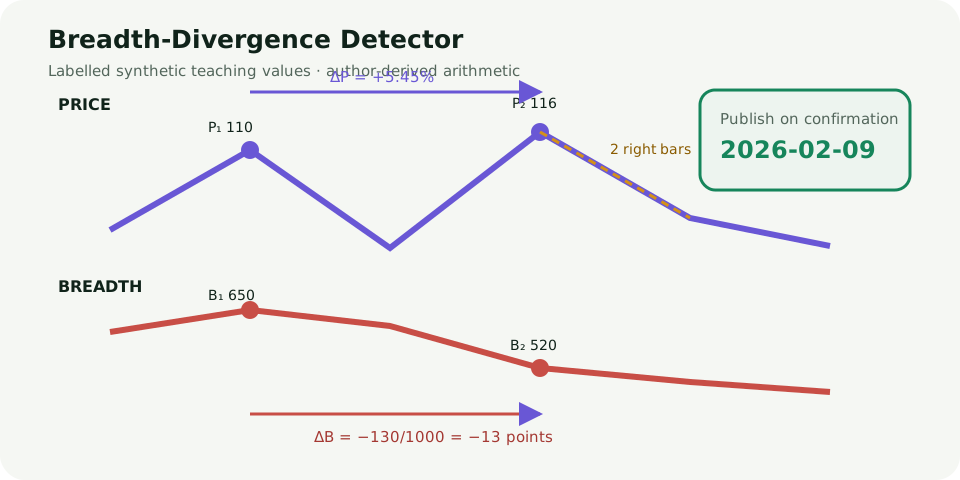
The SVG is not a decorative output card. It isolates the algorithm's actual learning obstacle: retrospective charts hide when the second pivot became knowable and how breadth units were normalized. Notice the labels and dashed or branched boundaries; color is supplementary.
Calculation flow
The Mermaid diagram renders from visuals/mermaid/calculation-flow.md and follows this pseudocode:
validate ordered aligned series and positive breadth_scale
confirm strict price pivots only after right-side bars exist
sample breadth on each price-pivot date
for adjacent same-kind pivots:
    price_change = (P2-P1)/P1
    breadth_separation = (B2-B1)/breadth_scale
    publish only when directional minimums pass
timestamp event on second_pivot_date + right bars
Validation comes first so bad evidence cannot mutate later state. That rule is especially important for recursive lines, timestamp grids, arming clocks, and right-side pivot confirmation.
Read the implementation
Python and TypeScript both:
- validate finite inputs and the topic's identity/clock rules;
- compute the named intermediate values;
- preserve the trace needed to audit the result; and
- return a numeric value or typed event only when the publication boundary passes.
They share datasets/canonical-fixture.json, including expected output and parameters. The code avoids provider SDKs and hidden network calls so the teaching arithmetic is fully inspectable.
Use the guided lab
Open visuals/animated/playground.html. Its objective is to reveal the second price pivot, its right-side confirmation bars, and the scale-normalized breadth separation.
The initial screen is the completed canonical state. Back and Step reveal one observation at a time; Play uses the same transition function; Pause stops it; Reset restores the scenario and parameter. Comparison isolates a nearby outcome, while Failure / boundary demonstrates a reason code rather than a persuasive fake value. Reduced-motion Play advances one deterministic step without starting a timer.
The diagnostic panel and audit table should be read together. A smooth chart alone cannot prove denominator topology, chronological completeness, sampling continuity, or causal confirmation.
Operational interpretation
Use the event trace to distinguish pivot date, confirmation date, price change, normalized breadth separation, and no-event states.
Do not misuse it: Do not pair independently optimized price and breadth pivots, normalize by a near-zero breadth observation, or timestamp the event before confirmation.
Passing the implementation checks proves definition fidelity. It does not prove reversal prediction, causal market explanation, trading profitability, transferability to another universe, or performance after costs.
Edge cases worth testing
- A second price pivot without all right-side bars is not yet an event.
- Equality at either minimum separation qualifies because the selected comparisons are inclusive.
- The breadth scale must be positive and fixed; changing units requires scaling it consistently.
- A price pivot with insufficient or same-direction breadth separation produces no event.
Provider corrections require recomputing the affected tail or event set. A corrected observation that becomes available later must not leak into an earlier point-in-time result.
Evidence and historical boundary
A named historical reconstruction remains deferred. Publication would require a licensed point-in-time universe, exact classification rules, synchronized observations, session and sampling policy, correction lineage, the selected calculation convention, a knowledge cutoff, and redistribution rights.
Using a famous chart without that bundle would make the story stronger and the evidence weaker. The labelled synthetic fixture is therefore the responsible public example.
Summary and handoff
You can now calculate ΔP=(P₂-P₁)/P₁; ΔB=(B₂-B₁)/S_B, interpret typed divergence event, audit the method-specific boundary, and reproduce matching Python and TypeScript behavior. Review Cumulative Advance/Decline Line and Advance/Decline Volume Line for the immediate input concept. Continue with Top-N Index Contribution in the dependency path.
Rendered from the canonical Mermaid sources linked by this article.
Calculation Flow — Breadth-Divergence Detector
Purpose: Retrospective charts hide when the second pivot became knowable and how breadth units were normalized.
Takeaway: Confirm first, normalize explicitly, then timestamp the event.
ReferencesPrimary sources and evidence notesExpand the source trail, evidence role, and limitations behind the engineering choices.
Expand the source trail, evidence role, and limitations behind the engineering choices.
Claim-to-source map
| Source ID | What it supports | Boundary |
|---|---|---|
FIDELITY-DIVERGENCE | A higher price high paired with a lower breadth high, or the inverse at lows, is commonly described as divergence. | The article does not define a causal pivot detector, thresholds, or predictive guarantee; those are explicit package choices. |
STOCKCHARTS-ADVL | Net advancing volume is advancing minus declining volume, and the line recursively adds it to the previous value. | The absolute level depends on the seed date; divergence commentary is not a performance guarantee. |
STOCKCHARTS-BREADTH | Exchange breadth series have explicit universe, update-frequency, and provider lineage; issue and volume breadth must retain series identity. | Provider symbols and data feeds do not make one universe or classification rule universal. |
The formula/concept source and the data-provenance source do different jobs. Exchange product documentation establishes venue fields, versioned feeds, and licensing boundaries; it does not silently define every derived indicator. Package-selected zero, seed, refresh, sampling, scale, and confirmation rules remain implementation choices.
FIDELITY-DIVERGENCE — Advance/Decline Indicator
- Organization or authors: Fidelity
- Source type: Maintained broker educational article
- Publication or effective date: 2026-04-20
- Version or retrieval state: Exact page or PDF retrieved 2026-07-26
- URL: https://www.fidelity.com/learning-center/trading-investing/advance-decline
- Accessed: 2026-07-26
- Jurisdiction or applicability: U.S. equity breadth education
- Evidence role: sourced/provider convention
- Supports: A higher price high paired with a lower breadth high, or the inverse at lows, is commonly described as divergence.
- Limitations: The article does not define a causal pivot detector, thresholds, or predictive guarantee; those are explicit package choices.
STOCKCHARTS-ADVL — Advance-Decline Volume Line
- Organization or authors: StockCharts ChartSchool
- Source type: Maintained provider-method documentation
- Publication or effective date: Current documentation
- Version or retrieval state: Exact page or PDF retrieved 2026-07-26
- URL: https://chartschool.stockcharts.com/table-of-contents/market-indicators/advance-decline-volume-line
- Accessed: 2026-07-26
- Jurisdiction or applicability: Exchange-specific breadth series
- Evidence role: sourced/provider convention
- Supports: Net advancing volume is advancing minus declining volume, and the line recursively adds it to the previous value.
- Limitations: The absolute level depends on the seed date; divergence commentary is not a performance guarantee.
STOCKCHARTS-BREADTH — Advance-Decline Indicators
- Organization or authors: StockCharts ChartSchool
- Source type: Maintained provider-method documentation
- Publication or effective date: Current documentation
- Version or retrieval state: Exact page or PDF retrieved 2026-07-26
- URL: https://chartschool.stockcharts.com/table-of-contents/index-and-market-indicator-catalog/advance-decline-indicators
- Accessed: 2026-07-26
- Jurisdiction or applicability: Provider series for major U.S. and Canadian exchanges
- Evidence role: sourced/provider convention
- Supports: Exchange breadth series have explicit universe, update-frequency, and provider lineage; issue and volume breadth must retain series identity.
- Limitations: Provider symbols and data feeds do not make one universe or classification rule universal.
Historical-example decision
Deferred. A named reconstruction requires the exact point-in-time universe, classification method, timestamps, correction lineage, session rules, calculation convention, and redistribution rights. This public package publishes labelled synthetic inputs and author-derived arithmetic instead. It makes no historical-association, prediction, causation, or profitability claim.
Full dependency-light reference implementations in both supported languages.
export type Result = Record<string, any>;
const numberValue = (value: unknown, name: string): number => {
  if (typeof value !== "number" || !Number.isFinite(value)) throw new Error(`${name} must be a finite number`);
  return value;
};

export function calculate(rows:any[],left=2,right=2,minPriceChange=.01,minBreadthSeparation=.05,breadthScale=1):Result {
  breadthScale=numberValue(breadthScale,"breadthScale");
  if(left<1||right<1||minPriceChange<0||minBreadthSeparation<0||breadthScale<=0)throw new Error("invalid divergence parameters");
  if(rows.some(row=>row.ready===false))return{status:"incomplete",reason:"unready observation",events:[]};
  rows.forEach((row,index)=>{const price=numberValue(row.index_level,`index_level[${index}]`);if(price<=0)throw new Error("index levels must be positive");numberValue(row.breadth_value,`breadth_value[${index}]`);if(index&&row.session_date<=rows[index-1].session_date)throw new Error("session dates must increase");});
  const highs:number[]=[],lows:number[]=[];
  for(let index=left;index<rows.length-right;index++){const price=rows[index].index_level,before=rows.slice(index-left,index).map(r=>r.index_level),after=rows.slice(index+1,index+right+1).map(r=>r.index_level);
    if(price>Math.max(...before)&&price>Math.max(...after))highs.push(index);if(price<Math.min(...before)&&price<Math.min(...after))lows.push(index);}
  const events:any[]=[];for(const [kind,pivots] of [["bearish",highs],["bullish",lows]] as const){for(let k=1;k<pivots.length;k++){const first=pivots[k-1],second=pivots[k],p1=rows[first].index_level,p2=rows[second].index_level,b1=rows[first].breadth_value,b2=rows[second].breadth_value,price_change=(p2-p1)/Math.abs(p1),breadth_separation=(b2-b1)/breadthScale;
    const match=kind==="bearish"?price_change>=minPriceChange&&breadth_separation<=-minBreadthSeparation:price_change<=-minPriceChange&&breadth_separation>=minBreadthSeparation;
    if(match)events.push({status:kind,first_pivot_date:rows[first].session_date,second_pivot_date:rows[second].session_date,confirmation_date:rows[second+right].session_date,price_change,breadth_separation,breadth_scale:breadthScale});}}
  events.sort((a,b)=>a.confirmation_date.localeCompare(b.confirmation_date));return{status:events.length?events.at(-1).status:"none",events};
}
The embedded lab now expands to its full document height, keeping the article as the only scroll surface.