
 By Islam Baraka
Turn a long series into a nearest-neighbor distance profile and recover repeated subsequences without counting trivial overlaps. This tutorial starts with the visual intuition, converts it into one exact contract, checks a synthetic example line by line, and then lets you challenge the result in an interactive lab.
Evidence boundary: every displayed price or sequence is synthetic teaching data. A correct match proves that the implementation follows the declared rule. It does not prove prediction, profitability, or investment suitability.
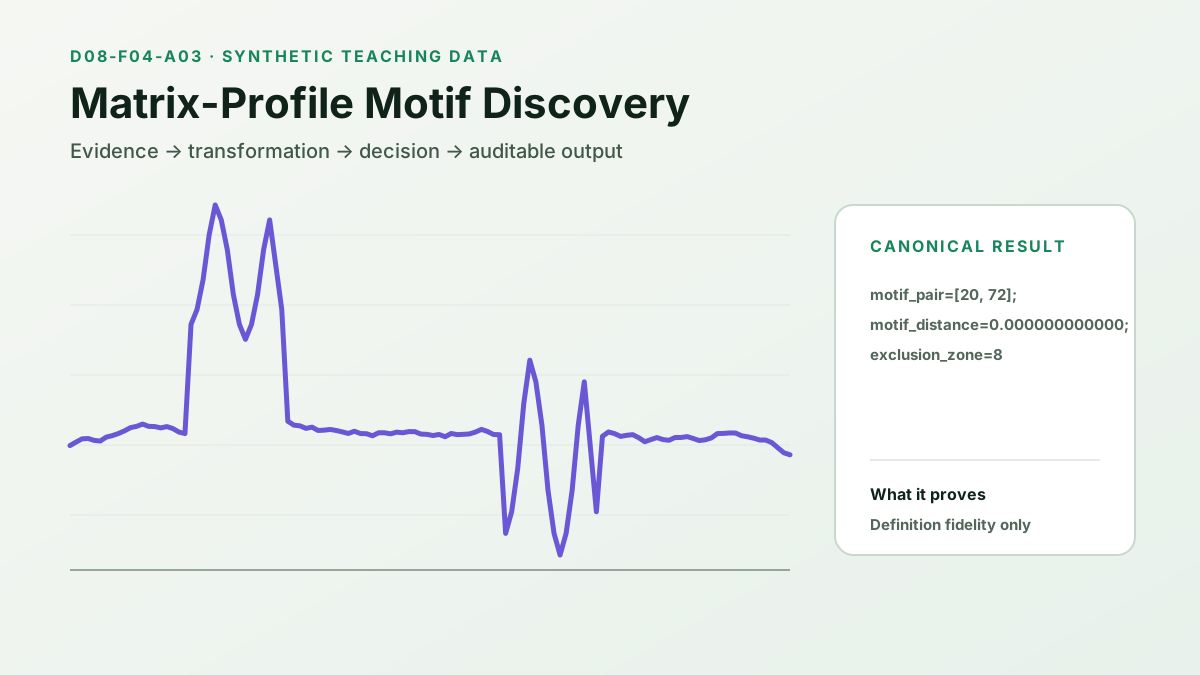
The practical question
When two analysts look at the same chart, they may agree on the broad shape and still disagree on the start, pivots, line placement, normalization, allowed deformation, confirmation, or score. Software cannot operate on “looks close.” It needs a contract whose inputs, comparisons, clocks, and failure states are observable.
For every subsequence start, the matrix profile stores the distance to its nearest eligible neighbor and the neighbor's index. The lowest profile value identifies a motif pair under the selected distance and exclusion zone.
That intuition is useful, but it is not yet an algorithm. The difficult work is deciding which information belongs to the calculation and what the output is allowed to mean.
First, identify the moving parts
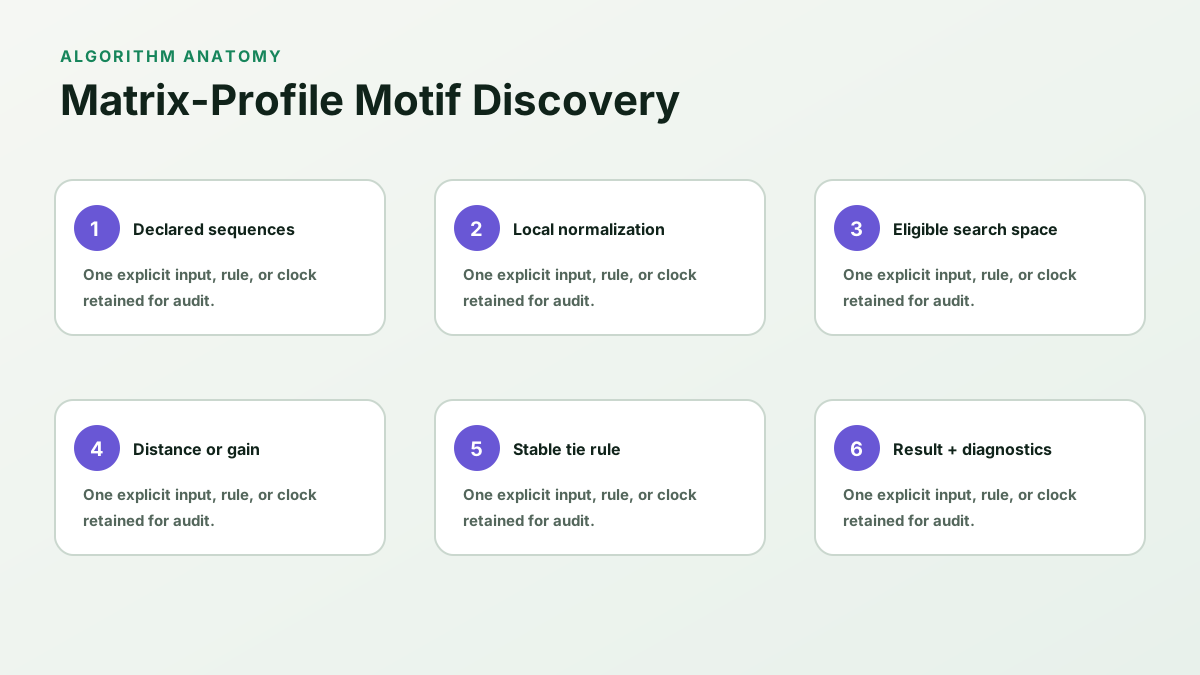
The package separates four layers:
- Evidence: finalized observations, declared roles, source identity, adjustment basis, and availability.
- Transformation: pivots and fitted lines for geometry, or normalization and distance for sequence matching.
- Decision: a full-precision threshold, tie, exclusion, radius, or crossing rule.
- Interpretation: a detector state or nearest match, never an automatic trade.
Mixing those layers is the fastest way to create a result that cannot be reproduced. For example, a chart can display a pivot at its event bar even though the detector needed two later bars to confirm it. A training procedure can display a clean threshold even though that threshold was selected using labels from the evaluation set. The visual is not the clock.
The canonical contract
This package selects the following rule:
P_i=min_{j:|i-j|>e} ||z(T_i,m)-z(T_j,m)||_2; I_i=argmin_j; e=ceil(m/2) by package default.
For every subsequence start, the matrix profile stores the distance to its nearest eligible neighbor and the neighbor's index. The lowest profile value identifies a motif pair under the selected distance and exclusion zone.
The contract is intentionally explicit about equality. Without an exclusion zone, overlapping copies of the same observation path dominate. The motif is nearest under the chosen length and normalization; it is not automatically a chart pattern or tradable event. Those details are not editorial footnotes; they change output and therefore belong in code, fixtures, and tests.
Read the geometry or distance before the label
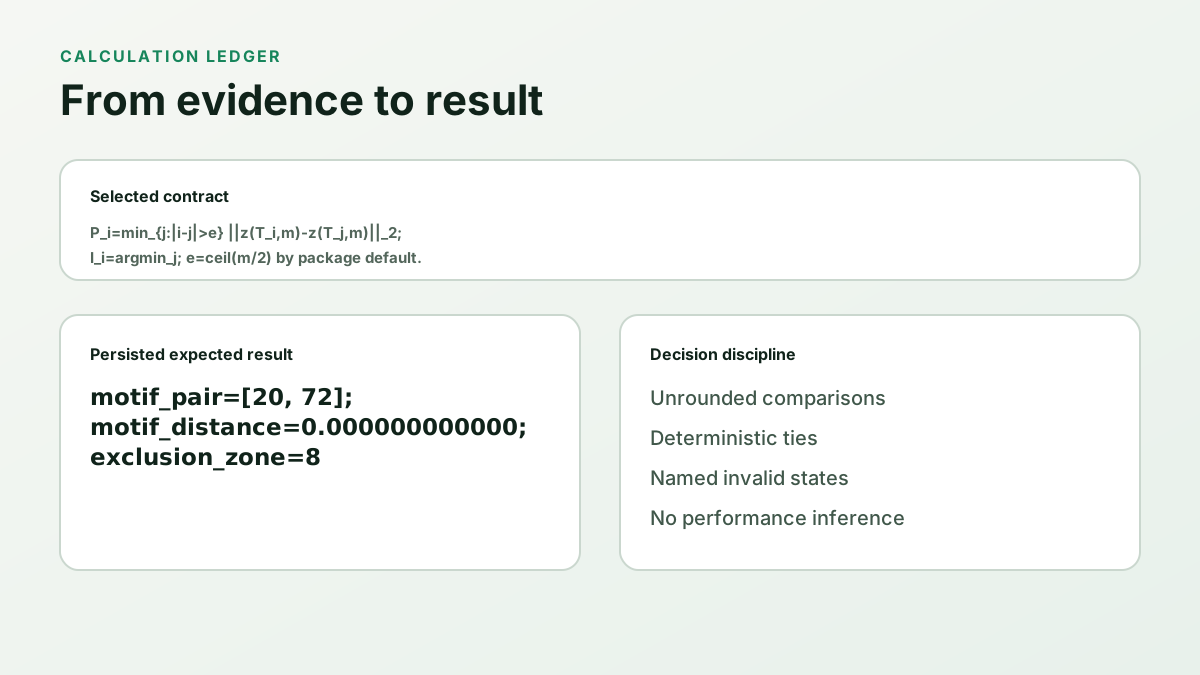
The canonical fixture produces:
motif_pair=[20, 72]; motif_distance=0.000000000000; exclusion_zone=8
The ledger exists so the label can be challenged. A learner should be able to hide the final state, inspect the inputs and intermediate diagnostics, predict the next transition, and then reveal the result. If a tutorial only shows the finished outline, it teaches recognition by hindsight rather than algorithmic reasoning.
A causal sequence matters
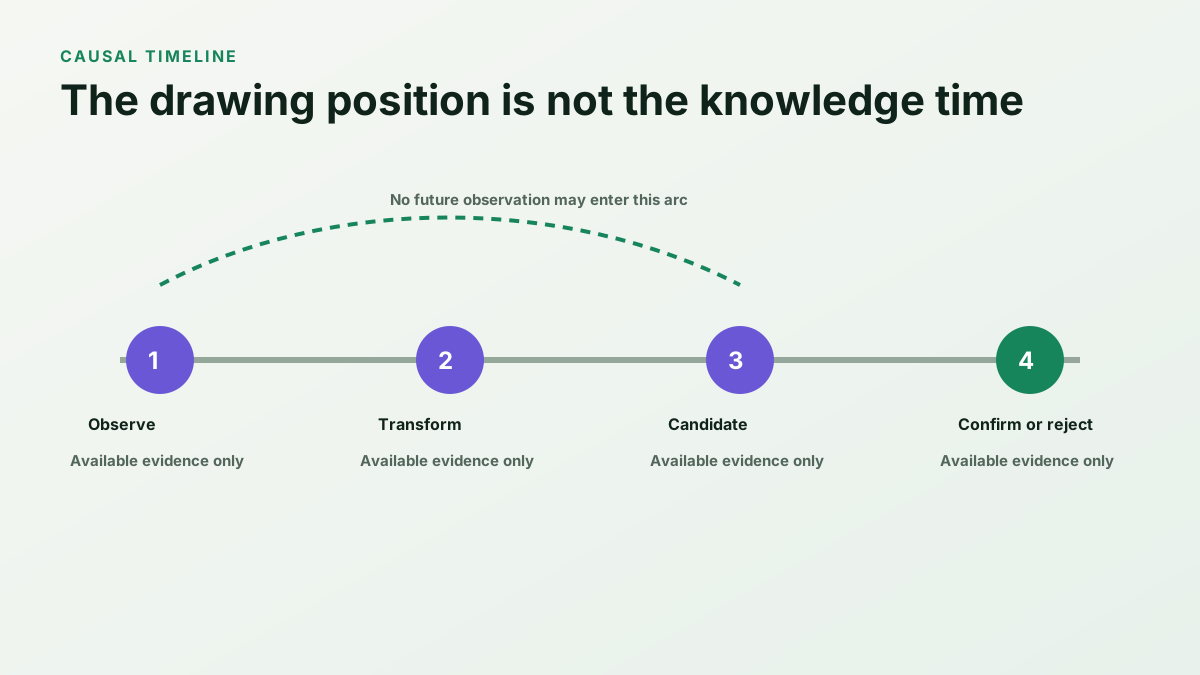
For matching topics, a live query window can only contain observations available by the evaluation time. Training transformations, shapelet thresholds, template selection, and parameter choices must be frozen before evaluation. A retrospective all-series visualization is useful for explanation only when it is labeled as retrospective.
This ordering prevents a subtle error: moving an annotation backward does not move knowledge backward. The lab makes the available prefix visible so the state cannot borrow an unrevealed observation.
Nearby methods answer different questions
Template matching searches for a supplied query. Matrix profile discovers nearest subsequence neighbors across the series. Shapelets optimize class discrimination instead of recurrence alone.
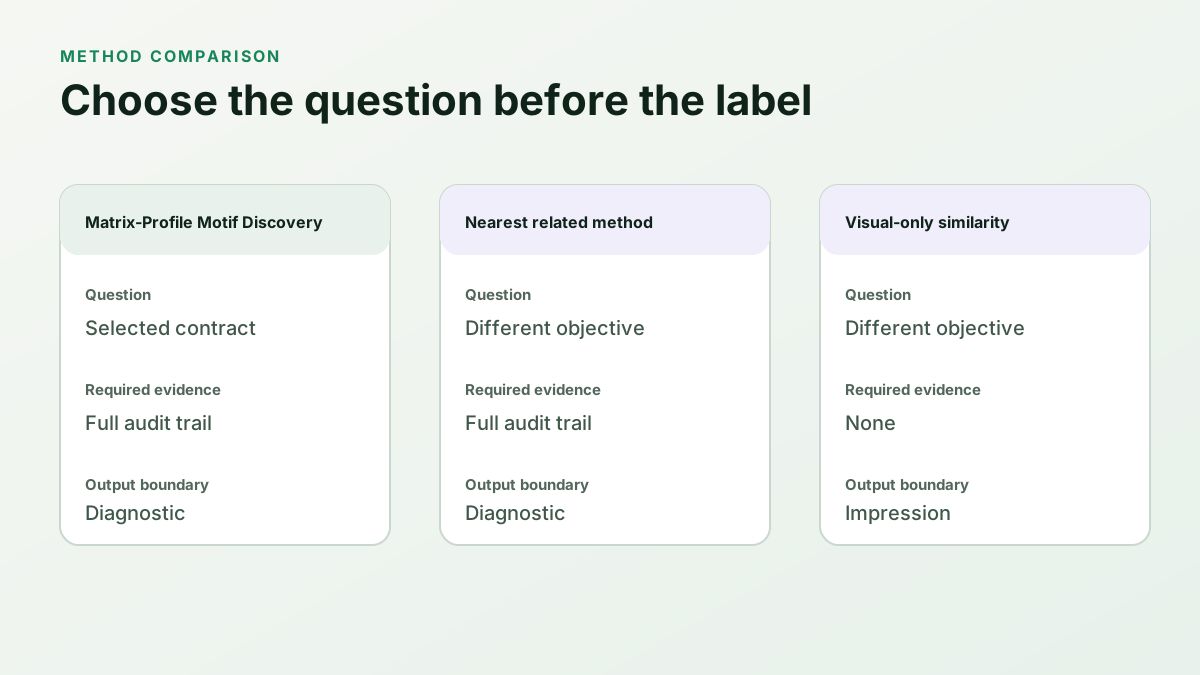
The method name should follow the contract, not the other way around. A converging consolidation with no qualifying pole remains a triangle under this package rather than becoming a pennant for visual excitement. A recurring subsequence is a motif under a selected distance and length; it is not a supervised shapelet unless class labels and a training procedure establish discrimination.
Reference implementation
The Python and TypeScript facades call the same family specification but execute independently. The readable implementation favors auditability over asymptotic speed. That makes every comparison and invalid state easy to inspect.
# See implementations/python/algorithm.py
result = run(canonical_input)
assert result["state_or_result"] == expected
The actual facade uses the topic's selected pattern or matching function and returns the full diagnostics. Production optimization is allowed only after parity tests preserve values, nulls, errors, reasons, and deterministic ties.
Tests that matter
A single happy-path snapshot is not enough. This package tests:
- the persisted canonical expected result;
- malformed, missing, nonfinite, and constant inputs;
- strict equality at a breakout, distance, or threshold boundary;
- causal prefix behavior and delayed pivot knowledge where relevant;
- offset and positive-scale invariance when z-normalization makes it valid;
- deterministic earliest-index and dynamic-programming ties;
- invalid DTW radii and matrix-profile exclusion settings;
- training/evaluation separation for shapelets;
- Python and TypeScript parity from one JSON fixture.
Passing those tests answers “did we implement this rule?” It does not answer whether a rule has a stable association with later returns after costs and selection effects.
Failure clinic
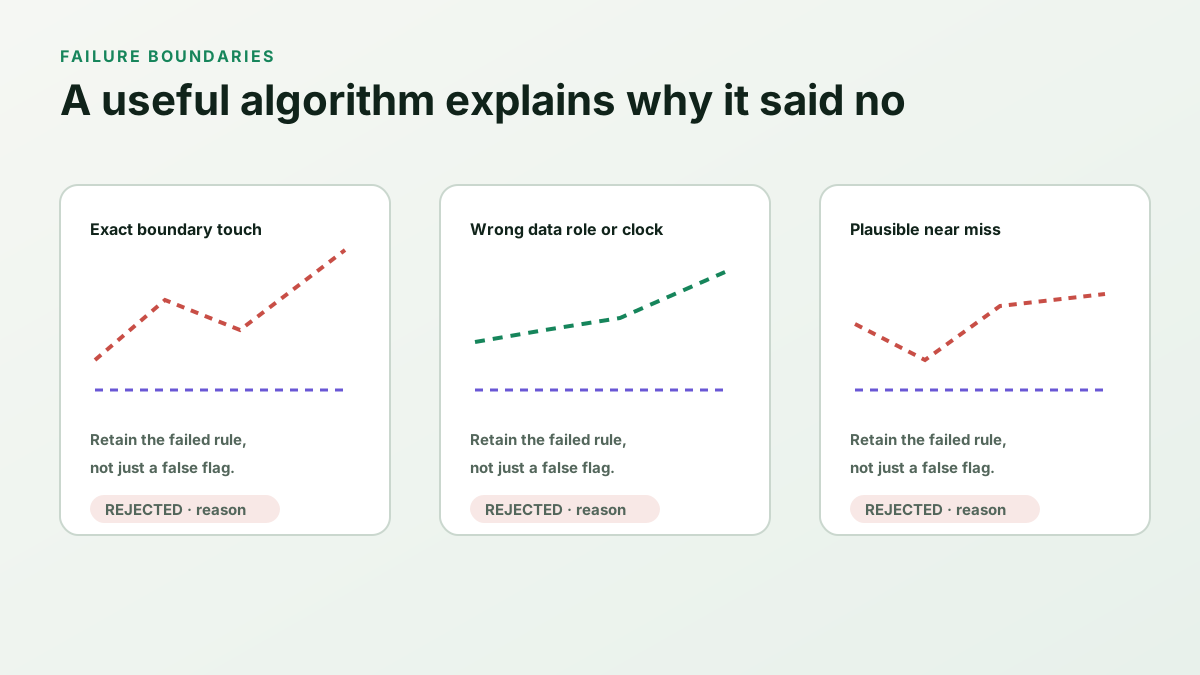
The most important failures are often plausible-looking successes:
- A split or roll discontinuity can look like a dramatic pole or perfect query.
- A permissive pivot window can manufacture the six points needed for a structure.
- A broad DTW radius can align unrelated paths by excessive deformation.
- Omitting a matrix-profile exclusion zone can return overlapping copies of the same subsequence.
- A constant candidate can be incorrectly called a perfect normalized match if zero variance is silently replaced with zero.
- A shapelet threshold chosen on evaluation labels can look accurate because the answer leaked into training.
- Repeatedly searching symbols, windows, templates, and thresholds inflates the chance of one striking result.
The correct response is not to ban flexible methods. It is to record the flexibility, predeclare evaluation, retain rejected cases, and state what the output does not prove.
Use the guided lab as an experiment
Open the guided playground. The lab begins with a complete canonical preview rather than an empty chart. Then:
- choose a canonical, boundary, failure, or comparison scenario;
- select a strict, canonical, or permissive parameter setting when the detector exposes one;
- predict the next state or best match;
- move backward or forward one meaningful observation or algorithm step;
- compare chart emphasis, diagnostics, guidance, and the audit trace;
- reset and verify that the canonical state returns deterministically.
The controls are keyboard-operable, remain at least 44 pixels high, respect reduced motion, and use text and shape in addition to color. The underlying datasets are dense enough to expose boundaries rather than merely make the screen look active.
Historical example: why it is not useful yet
A named security example is deliberately omitted from this mechanics-first package. A defensible case would require licensed point-in-time data, exact security and venue identity, sessions and time zone, adjustment basis, source revisions, parameter vintage, and a selection protocol declared before inspecting the outcome. Without that record, a historical screenshot adds storytelling but weakens verification.
Synthetic data is not inherently less rigorous. Here it lets us set a pivot, slope, distance, path, exclusion, or threshold to an exact boundary and verify both sides of the rule.
What you can now do
You can explain Matrix-Profile Motif Discovery without hand-waving, reproduce the canonical result, identify material variants, inspect a failure, and implement the same behavior in Python and TypeScript. More importantly, you can refuse the wrong conclusion: a plausible pattern or small distance is not a probability, forecast, or recommendation.
Next, compare this topic with the other members of Pattern Matching and choose the algorithm whose question matches the research problem. Geometry, query search, motif discovery, and supervised classification are related tools, not interchangeable labels.
Primary references
The package records source roles, versions, access dates, and limitations in REFERENCES.md. The canonical definitions and implementation choices remain in the topic README, which is the factual source for this article.
Rendered from the canonical Mermaid sources linked by this article.
Reasoning Flow — Matrix-Profile Motif Discovery
Purpose: keep evidence, transformation, decision, and interpretation in the correct order.
Takeaway: a result is valid only under the declared data role, clock, parameters, and boundary policy.
ReferencesPrimary sources and evidence notesExpand the source trail, evidence role, and limitations behind the engineering choices.
Expand the source trail, evidence role, and limitations behind the engineering choices.
All web sources were accessed 2026-08-11. Package thresholds, tie rules, synthetic fixtures, and displayed calculations are implementation choices or author-derived unless a source role explicitly says otherwise.
S1 — Foundations of Technical Analysis
- Organization or authors: Andrew W. Lo, Harry Mamaysky, and Jiang Wang
- Source type: Original working paper and peer-reviewed article record
- Publication or effective date: 2000
- Version: NBER Working Paper 7613; Journal of Finance 55(4)
- URL or DOI: https://www.nber.org/papers/w7613 and https://doi.org/10.3386/w7613
- Accessed: 2026-08-11
- Supports: Chart-pattern subjectivity, the need to convert visual descriptions into systematic algorithms, and separation of detection from empirical return analysis.
- Limitations: Does not define this package's slopes, thresholds, state machine, matching distance, or profitability.
S2 — SciPy find_peaks
- Organization or authors: SciPy project
- Source type: Official maintained technical documentation
- Publication or effective date: current documentation
- Version: SciPy 1.17.0 documentation observed at access
- URL or DOI: https://docs.scipy.org/doc/scipy/reference/generated/scipy.signal.find_peaks.html
- Accessed: 2026-08-11
- Supports: Local-maximum comparison and the fact that distance, prominence, width, and plateau policies are configurable peak-selection properties.
- Limitations: SciPy's retrospective peak finder is comparison evidence; it does not define this package's causal right-window availability or financial structure rules.
S3 — The Probability of Backtest Overfitting
- Organization or authors: David H. Bailey, Jonathan M. Borwein, Marcos López de Prado, and Qiji Jim Zhu
- Source type: Original research paper record
- Publication or effective date: 2015 revision
- Version: SSRN 2326253
- URL or DOI: https://papers.ssrn.com/sol3/Papers.cfm?abstract_id=2326253 and https://doi.org/10.2139/ssrn.2326253
- Accessed: 2026-08-11
- Supports: The misuse boundary around selecting many detector configurations on the same historical sample.
- Limitations: Does not validate any pattern or matching configuration in this package.
S4 — Matrix Profile I: All Pairs Similarity Joins for Time Series
- Organization or authors: Chin-Chia Michael Yeh, Yan Zhu, Liudmila Ulanova, Nurjahan Begum, Yifei Ding, Hoang Anh Dau, Diego Furtado Silva, Abdullah Mueen, and Eamonn Keogh
- Source type: Original peer-reviewed conference paper
- Publication or effective date: 2016
- Version: IEEE ICDM 2016
- URL or DOI: https://doi.org/10.1109/ICDM.2016.0179 and https://www.cs.ucr.edu/~eamonn/PID4481997_extend_Matrix%20Profile_I.pdf
- Accessed: 2026-08-11
- Supports: Matrix-profile and profile-index definitions, nearest-neighbor subsequence interpretation, trivial-match exclusion, and motif recovery.
- Limitations: The package uses a transparent quadratic reference implementation, not the paper's scalable FFT-based algorithm.
Applicability decision
The cited paper defines the algorithmic primitive. Per-window population z-normalization, deterministic earliest-index ties, squared local DTW cost, path-RMS reporting, the exact exclusion-zone default, and threshold tie-breaking are package-selected conventions. All financial-looking series are synthetic.
Full dependency-light reference implementations in both supported languages.
/** Topic facade for D08-F04-A03 — Matrix-Profile Motif Discovery. */
import { matrixProfile } from "../../../shared/typescript/matching.ts";
export const discover = (series: number[], window: number, exclusionZone?: number) => matrixProfile(series, window, exclusionZone);
The embedded lab now expands to its full document height, keeping the article as the only scroll surface.